Skip to content
SillagePRO

For professional cycling teams

The stage, from recon to debrief.

Sillage Pro brings together the road book, the 3D race replay for the whole team, the simulator, load monitoring and the work of every member of staff. Each rider chooses, one type of data at a time, what the staff can see.

Distance
86.5km
Elevation gain
3,459m
Climbs
5incl. 2 HC
Official start
11:15
The Vizille – Alpe d’Huez stage in relief: the route raised to its altitude and coloured by gradient, from the Rampe de Laffrey to the Col d’Ornon, then the final climb to Alpe d’Huez.

StartVizille

C1Rampe de Laffrey · 8.6 km at 7.7%

C3Col d’Ornon · 16.6 km at 5.7%

C5Alpe d’Huez · 15.1 km at 7.3%, finish

−8% −2% flat 2% 4% 6% 8% 10% 12% 15%

Tour de l’Oisans, stage 3 · Vizille – Alpe d’Huez. The route raised to its altitude (relief exaggerated seven and a half times), coloured by gradient as in the road book. Demonstration route, plotted on OpenStreetMap.

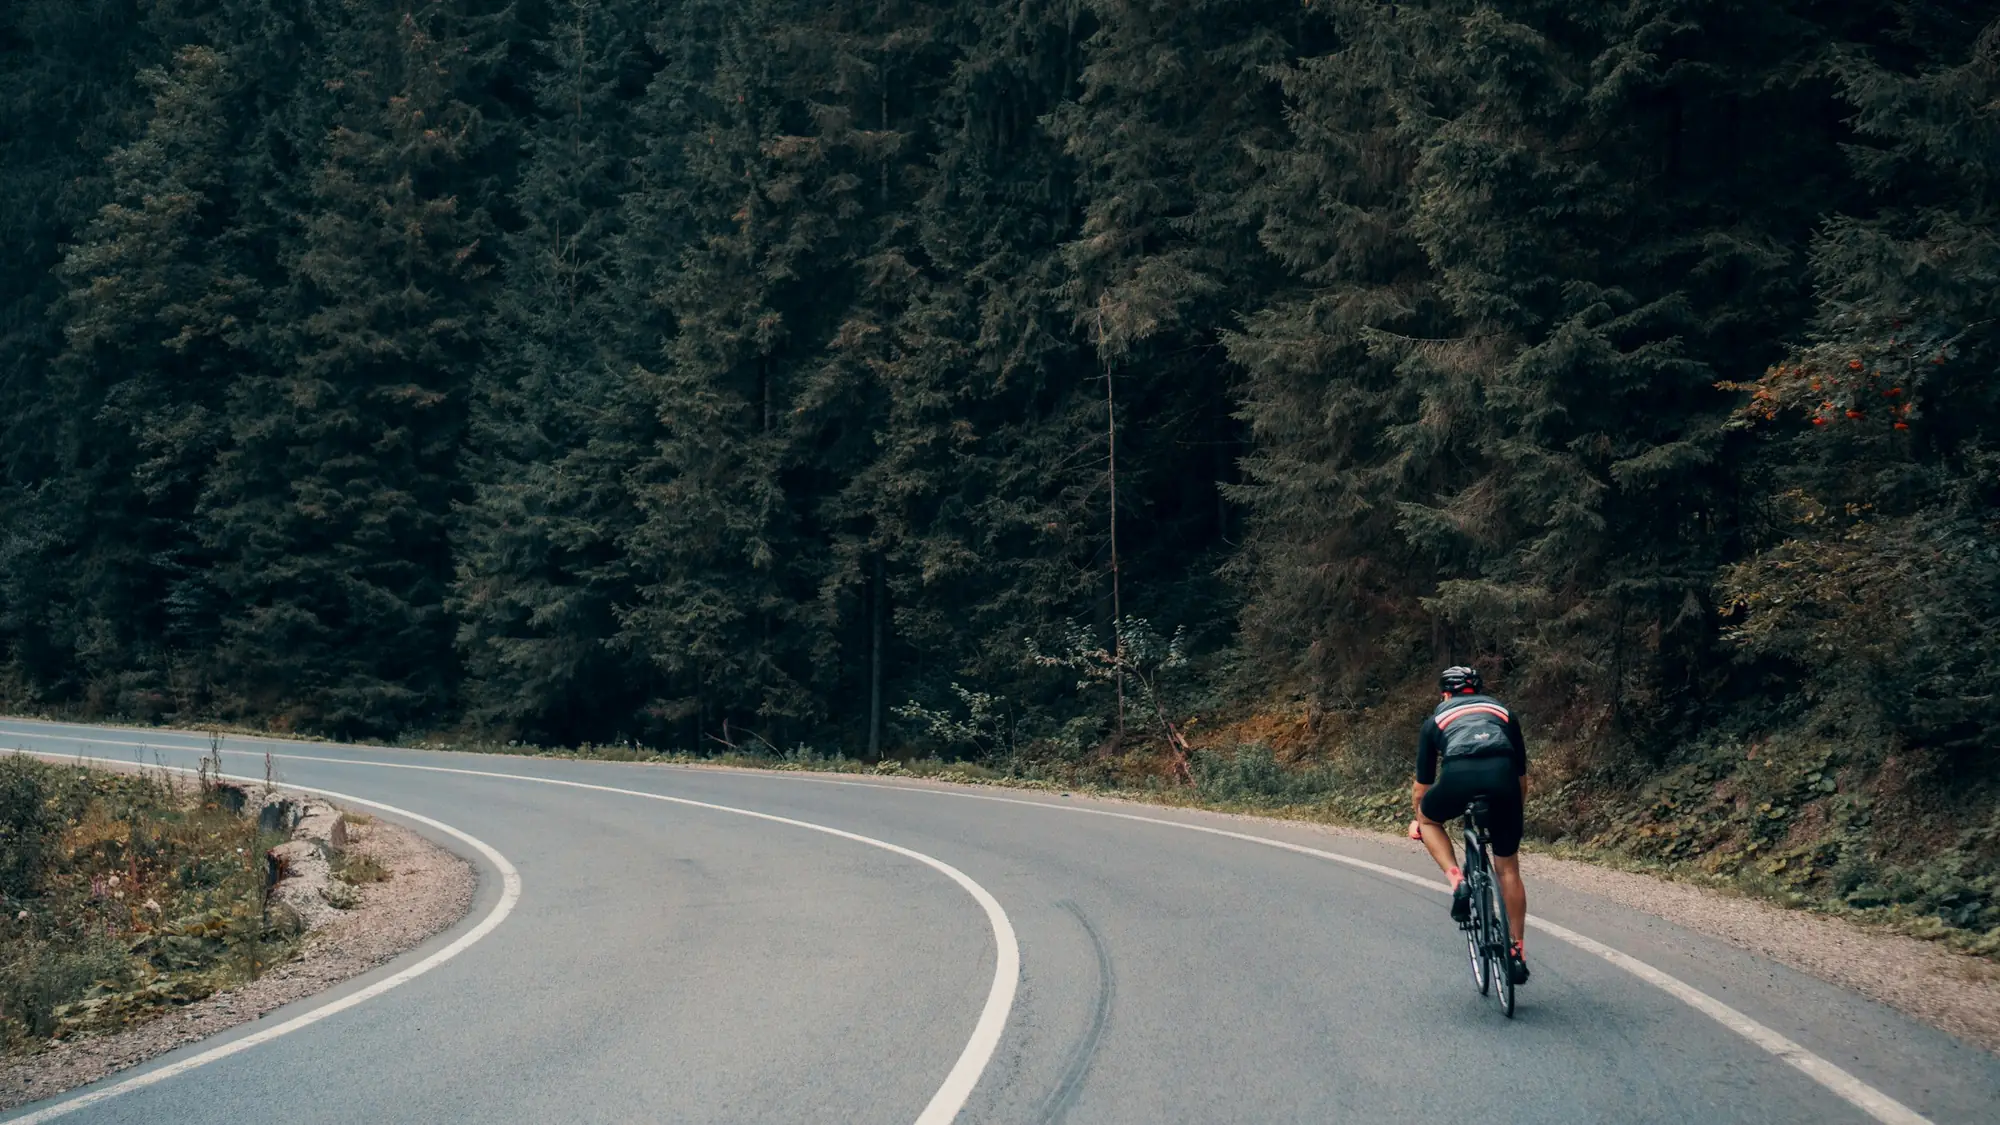
A rider seen from behind on a bend of a mountain road, among the fir trees.
What the team knows about a route, a race and every rider, in one place.
Photo: Viktor Bystrov, Unsplash

The whole team, on the same clock.

Files from the bike computers are laid on the route and replayed second by second, in 3D over the terrain. The standings show the gaps in time and in metres, the speed, and the power of the riders who have shared it.

Watch the race in real time or up to 120 times faster. On the team bus, it plays on the big screen and is controlled from a tablet.

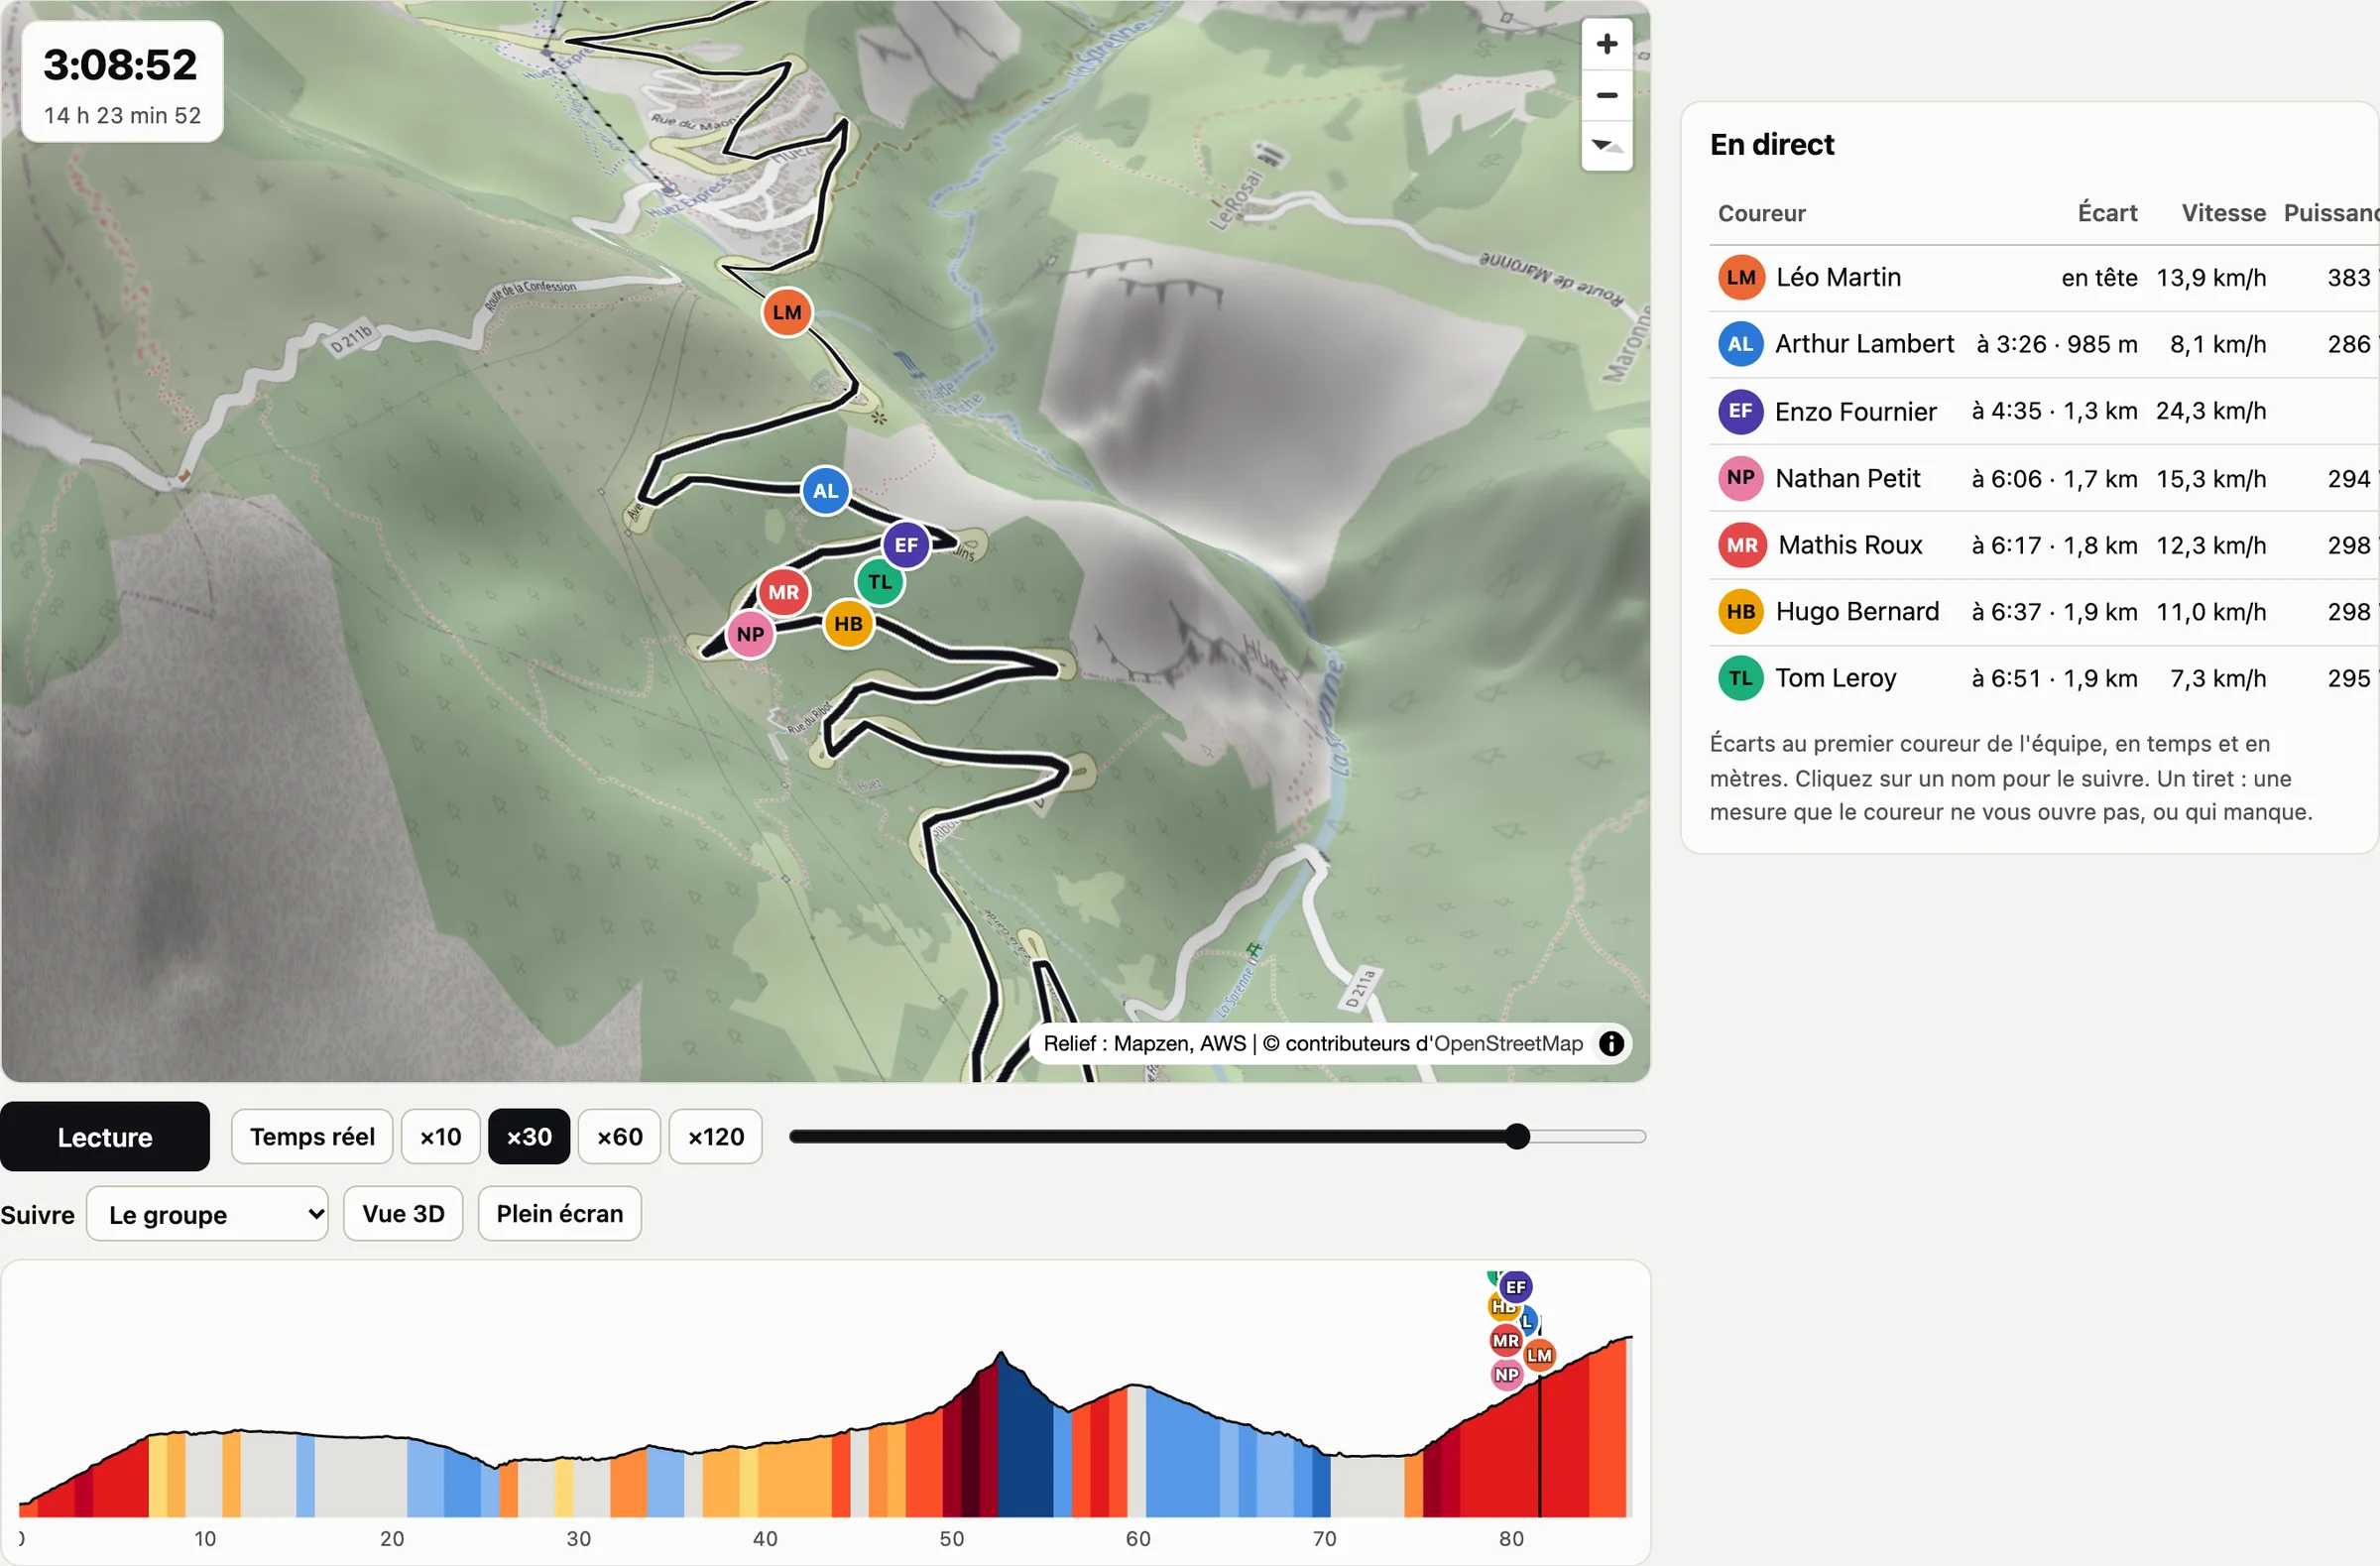
The race replay on the hairpins of Alpe d’Huez: the relief map with a marker for each rider, live standings with gaps, speed and power, and the stage profile with each rider placed on it.

Sixteen kilometres of climbing, second by second.

The team’s time gaps on the climb to Alpe d’Huez, taken from the race replay. Each line is a rider, in their lane colour; at the bottom, the gradient.

02 min46810121416707274767880828486km1,810 m715 mLMLéo Martin3:23:41 · 364 WALArthur Lambert+8:54 · 310 WEFEnzo Fournier+9:28 · power not sharedNPNathan Petit+13:31 · 296 WMRMathis Roux+14:15 · 302 WHBHugo Bernard+15:15 · 310 WTLTom Leroy+16:00 · 314 W

Enzo Fournier shares only his GPS tracks: his position and time are shown, his power nowhere. An eighth rider has shared nothing with the sports director and does not appear.

How a stage unfolds

From the first look at the route to the evening debrief, then right through the season. The screens are from the app, using the demo team.

D−7

The recon

Recon the route before you travel to it. Fly over it in 3D, climb by climb, then ride the decisive section on a smart trainer, picked with sliders on the profile. The trainer reproduces the gradient; speed is calculated with each rider’s own mass and wind. Anything spotted on the road becomes a recon note, placed to the kilometre and called out during the session.

  • 3D flyover, climb by climb
  • Ghost of a previous recon
  • Recon notes, waypoints imported from VeloViewer
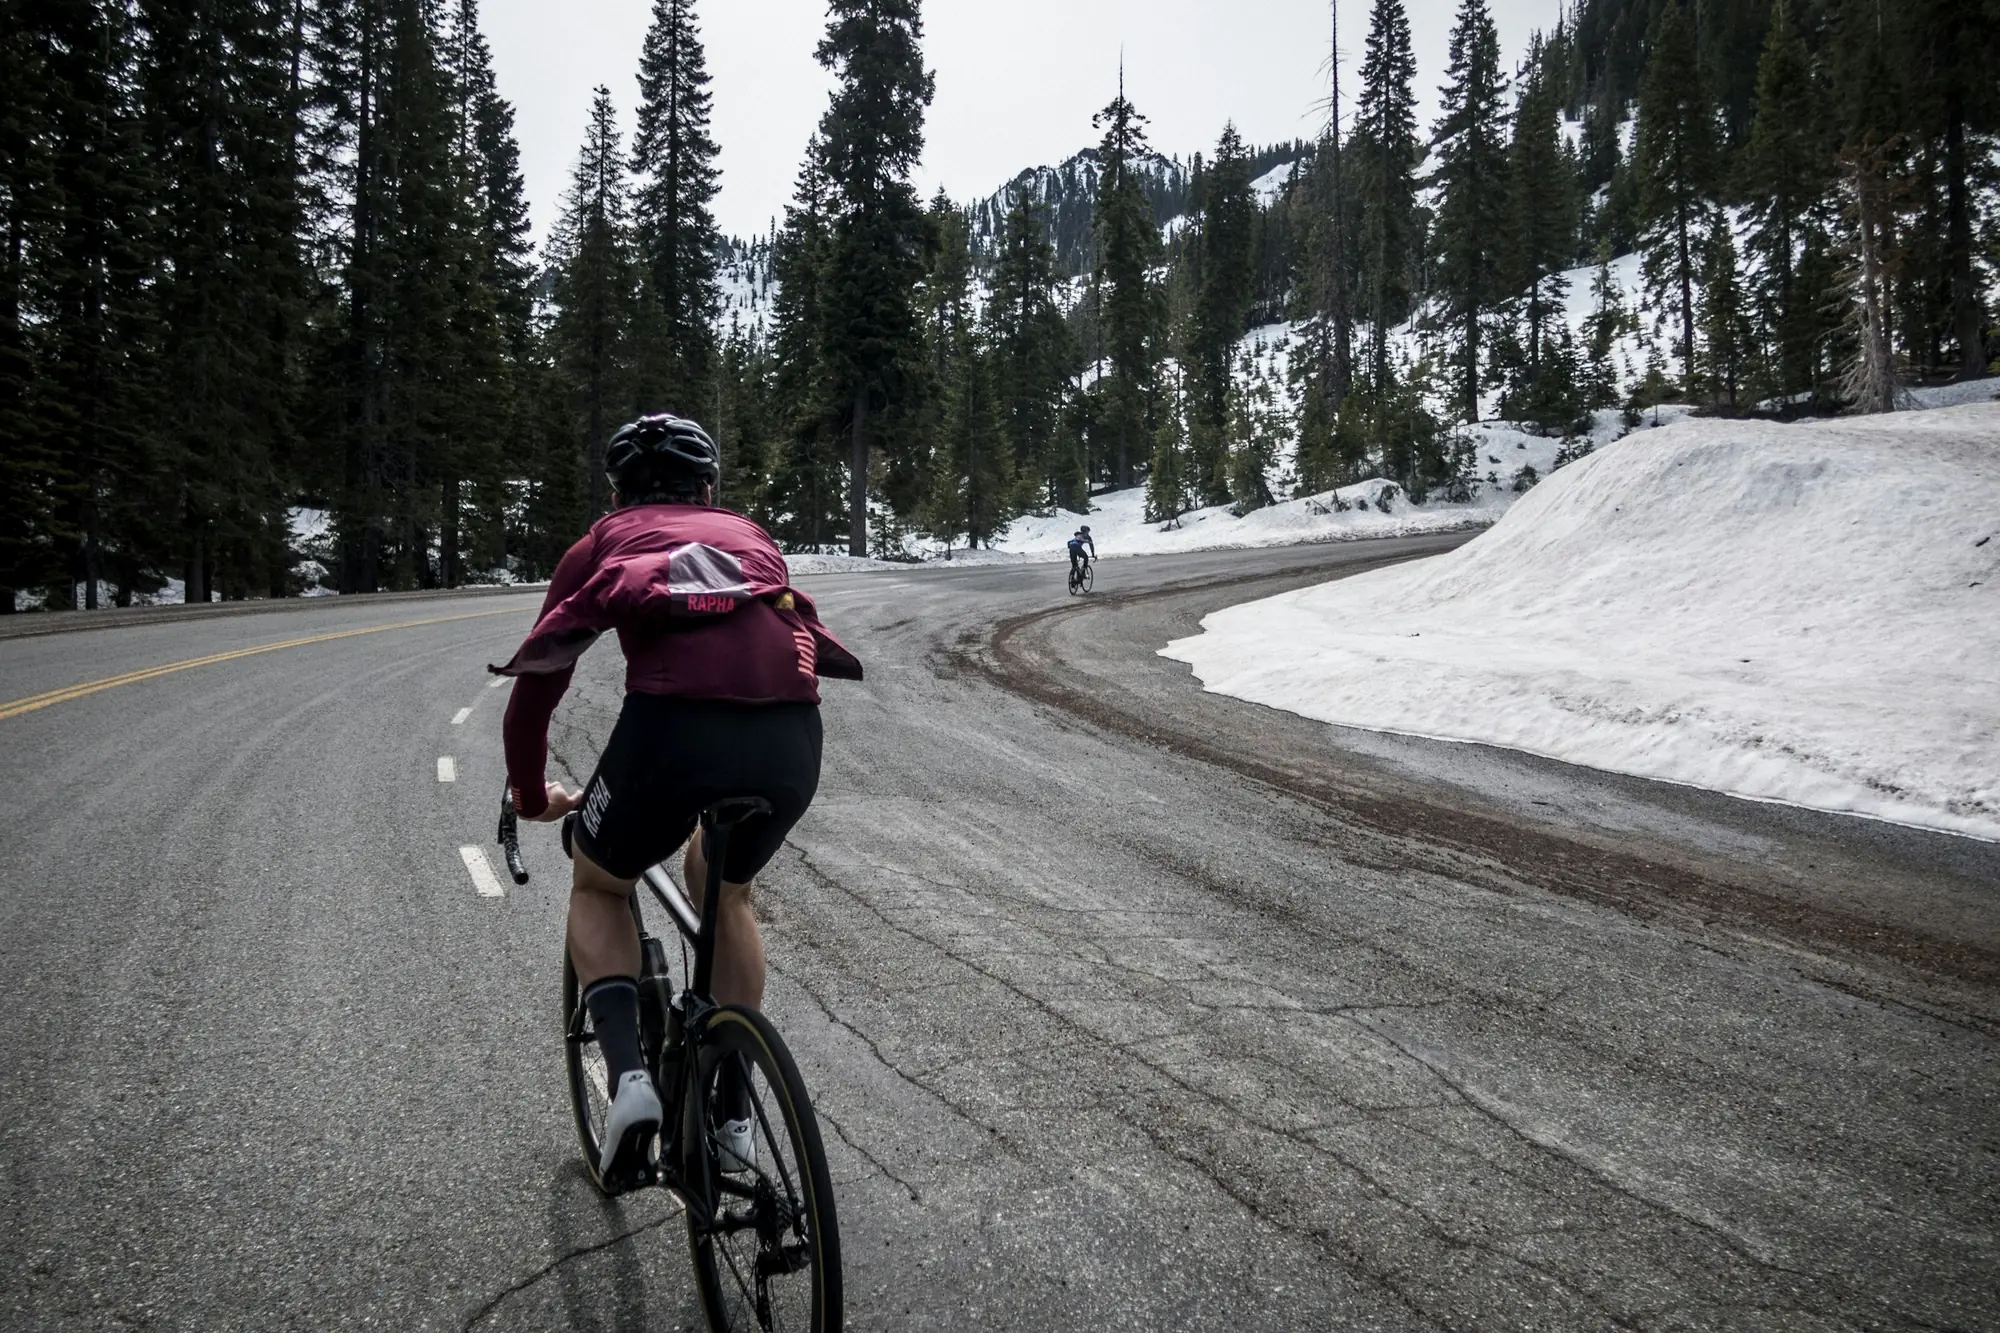
A rider seen from behind, in a red jersey, on a mountain pass road lined with snow. Photo: Ben Guernsey, Unsplash
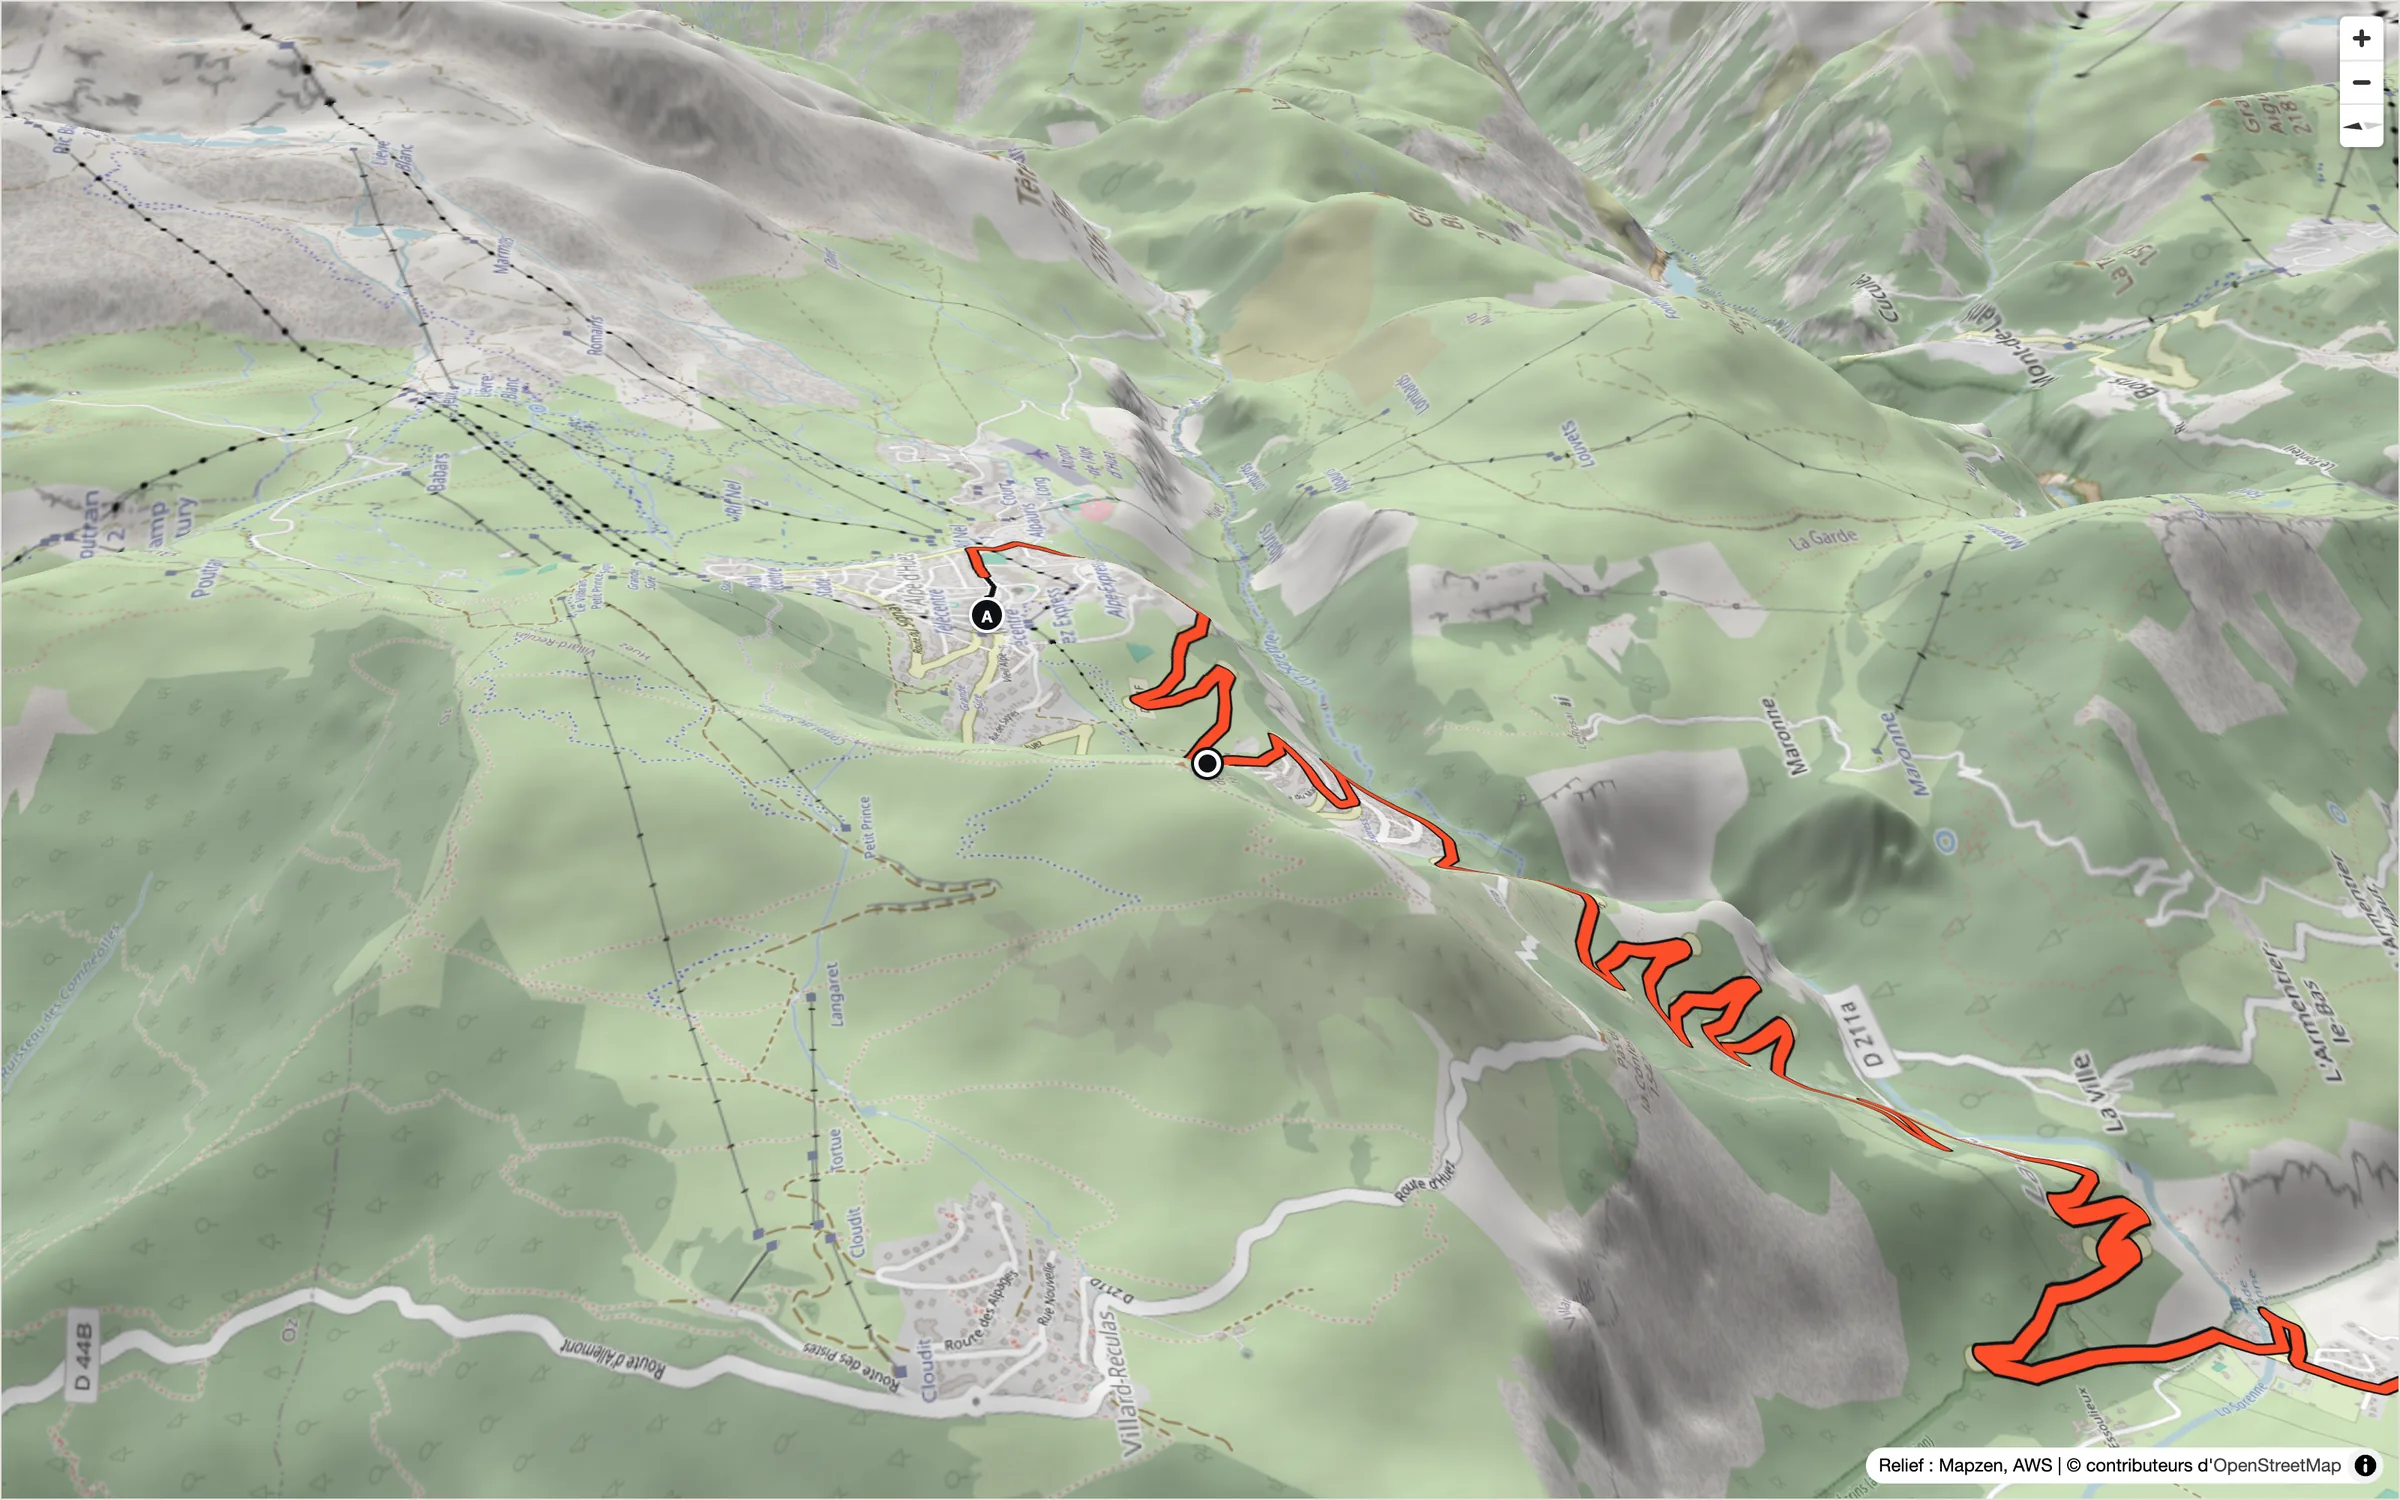
The 3D flyover of the climb to Alpe d’Huez: the road in red through the hairpins, over the terrain.
Recon on the smart trainer: the stage profile, two sliders to pick the section, and the five climbs.
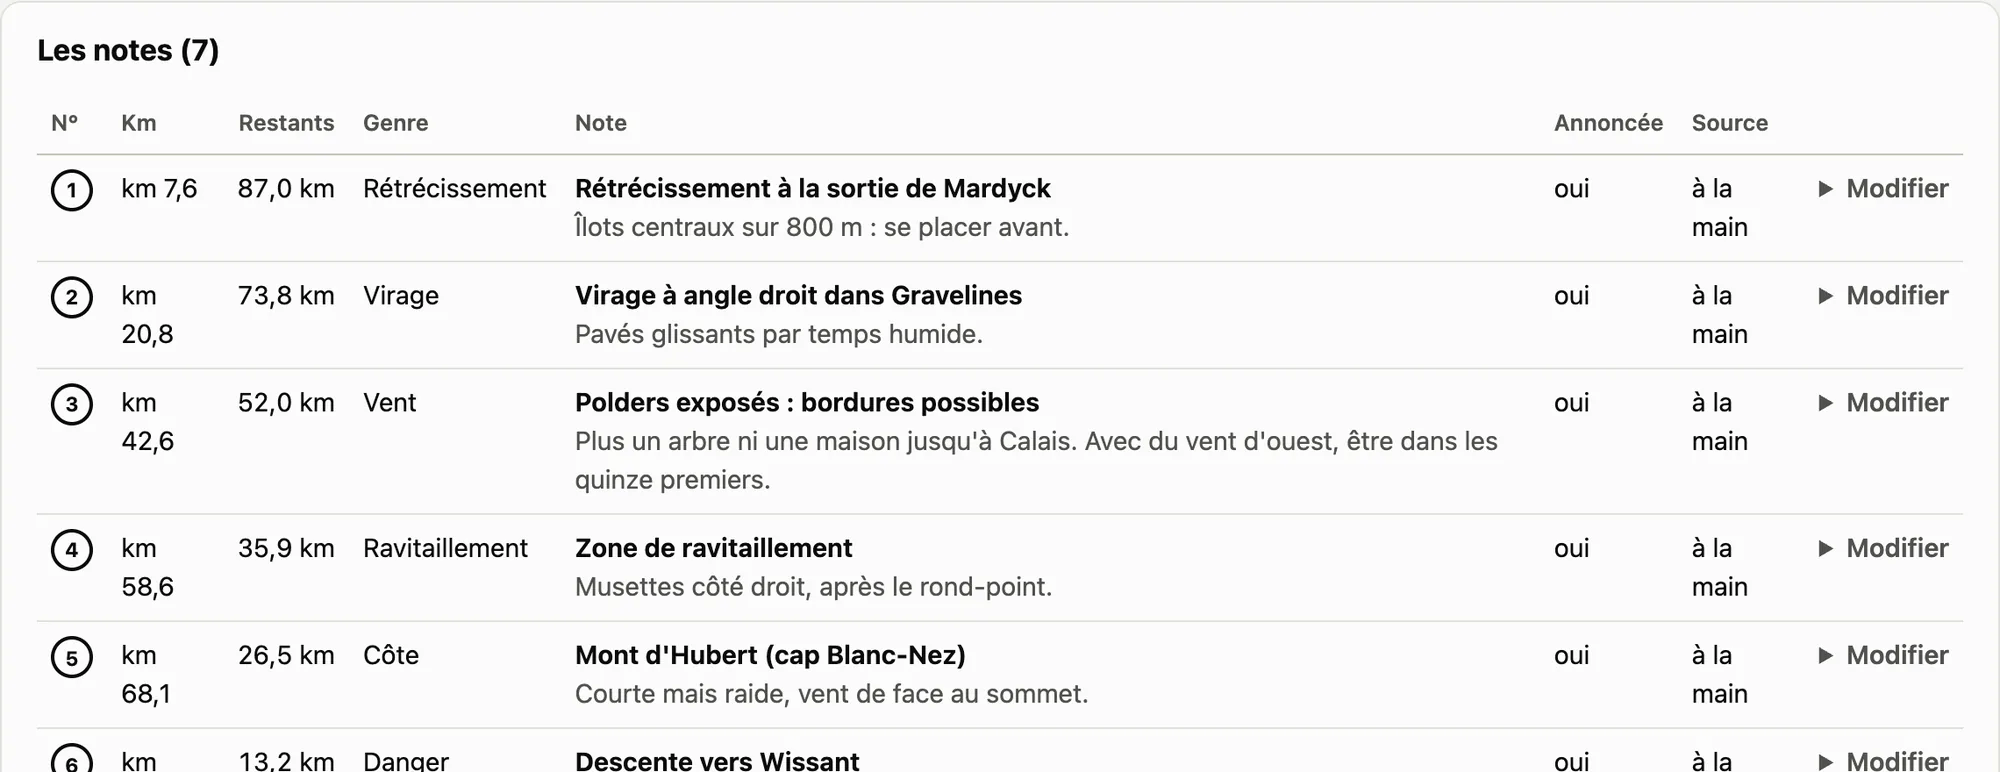
The recon notes for the Boucles des Polders: road narrowing, bend, possible echelons, feed zone, climb, descent, sprint, each at its kilometre.

3D flyover, smart trainer recon and recon notes. Pick the section with the sliders or by clicking on a climb; the time is recalculated by the server and kept separate from road times.

D−2

Tactics

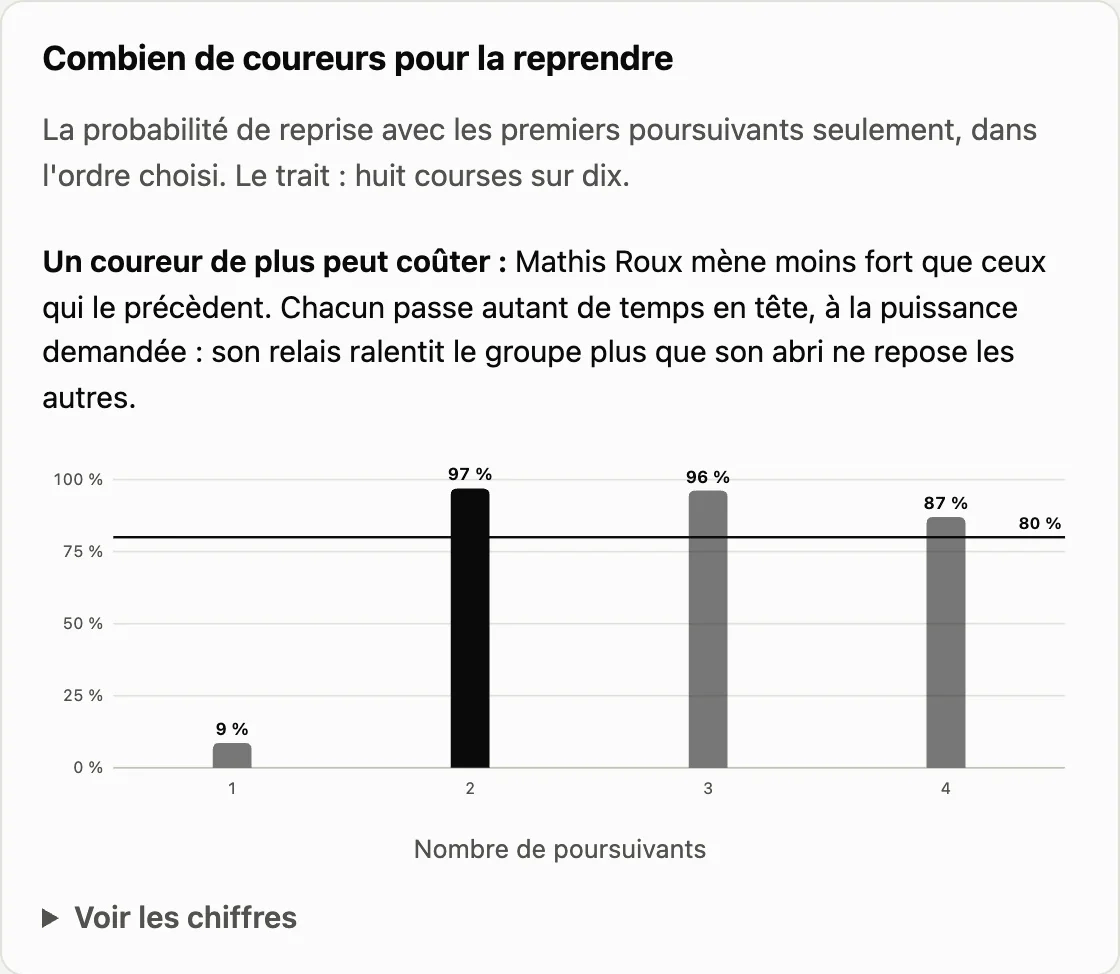
The simulator races the stage hundreds of times, with your settings and your riders’ personal bests. Do you need two riders or four to bring back the break, and where will it be caught? Where should you attack on Alpe d’Huez? These are estimates; the method is set out under each result.

  • Bringing back a break
  • Where to attack on a climb
  • What the chase costs each rider
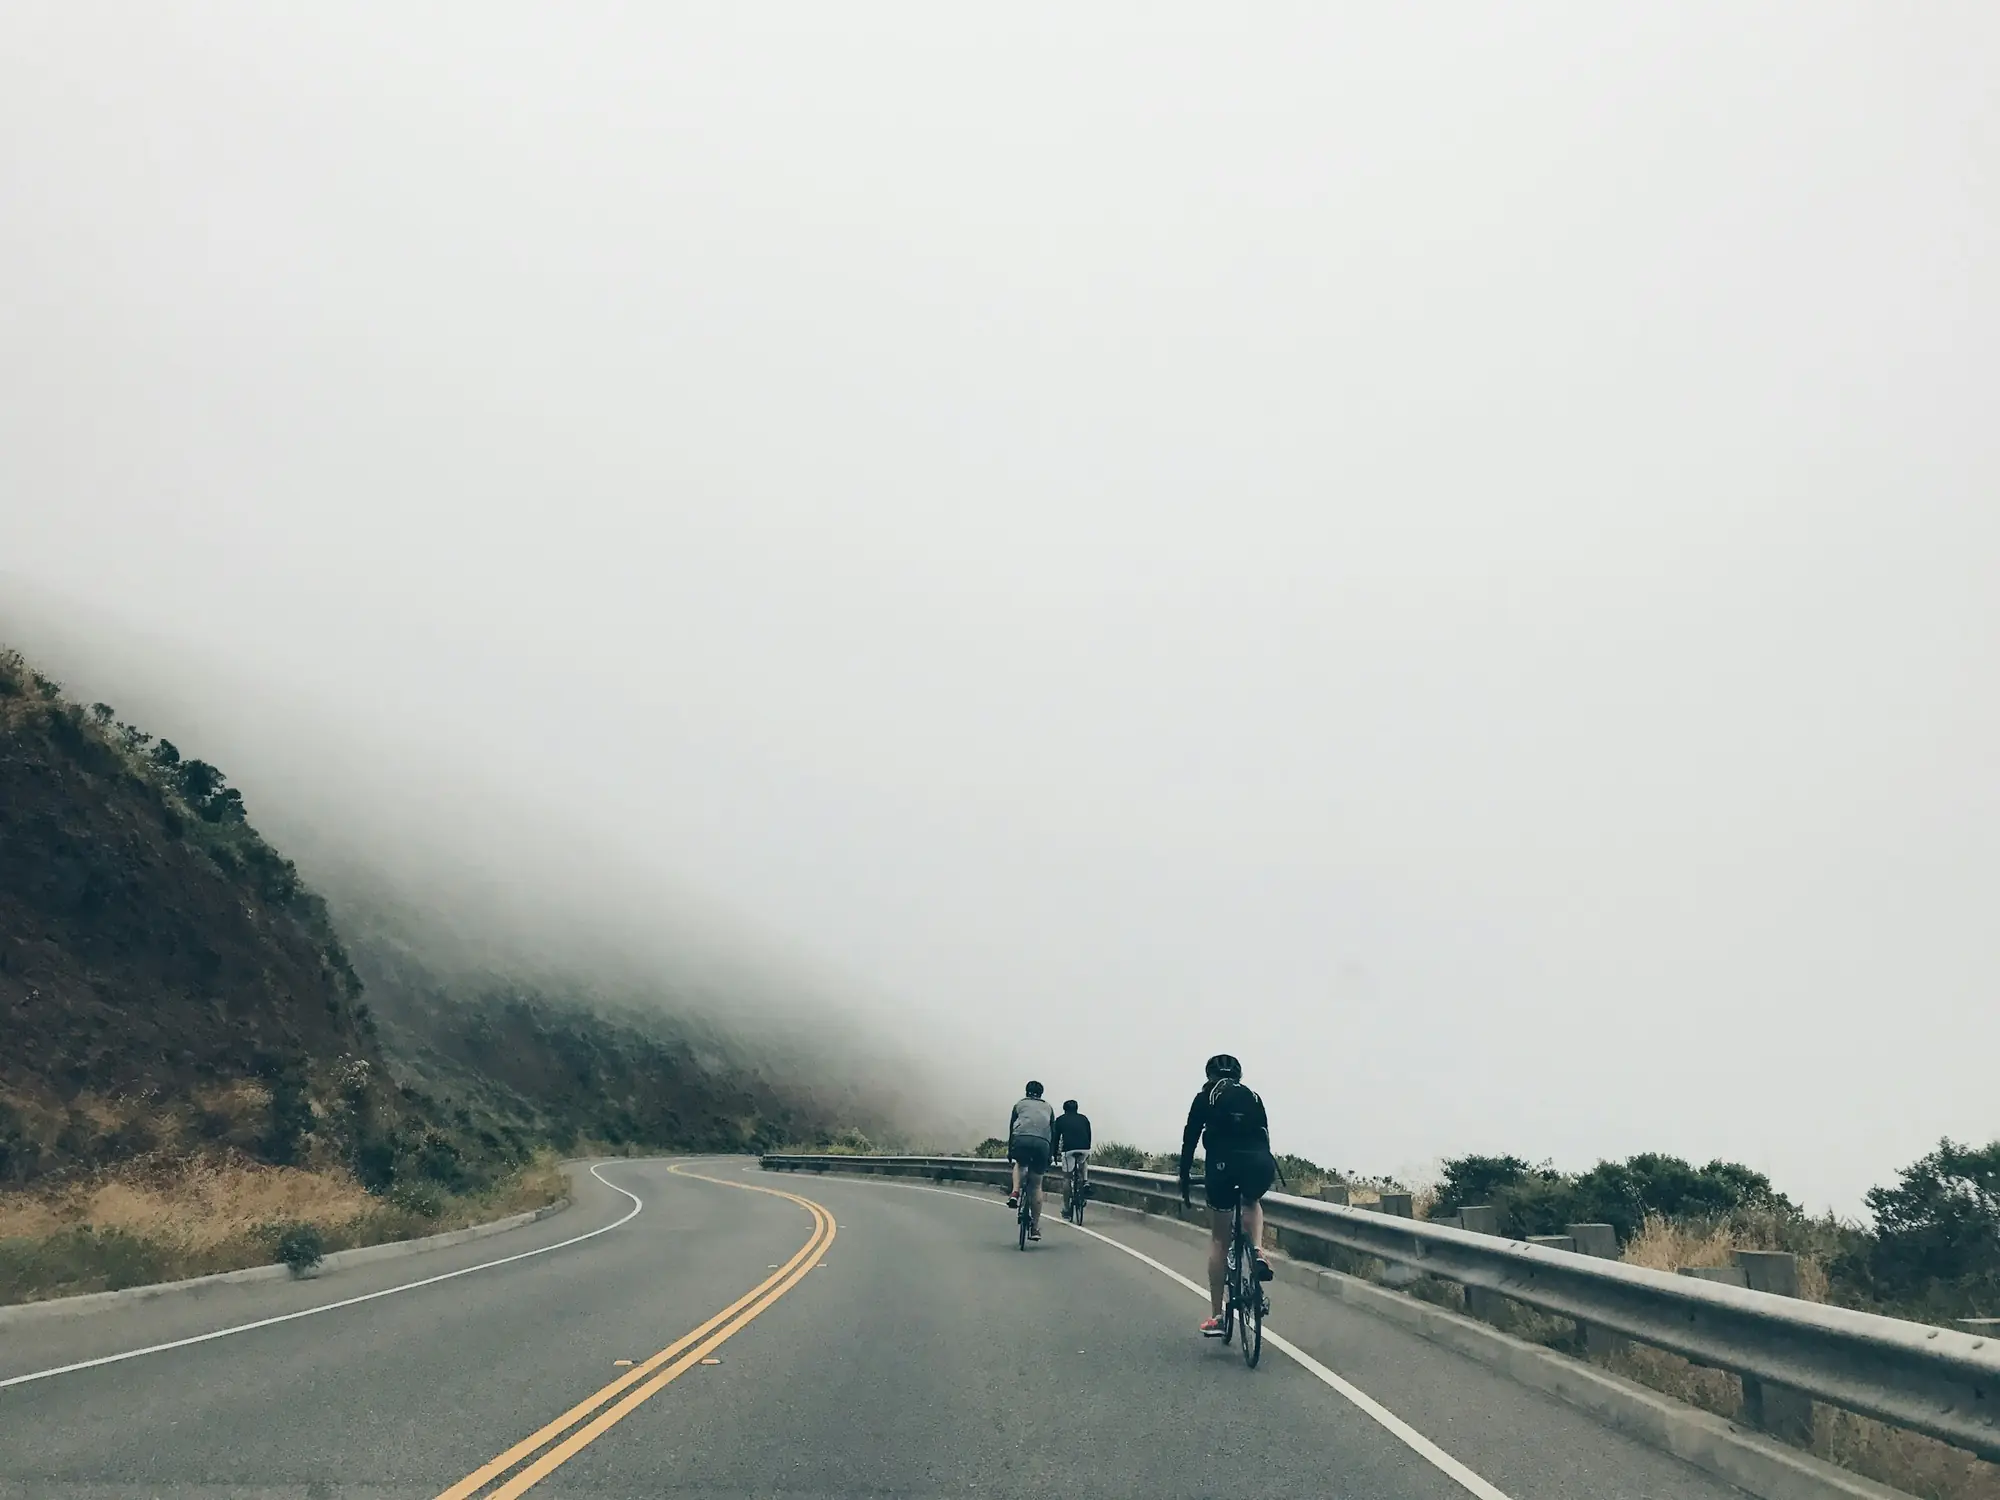
Three riders on a mountain road that disappears into the fog. Photo: Tessa Rampersad, Unsplash

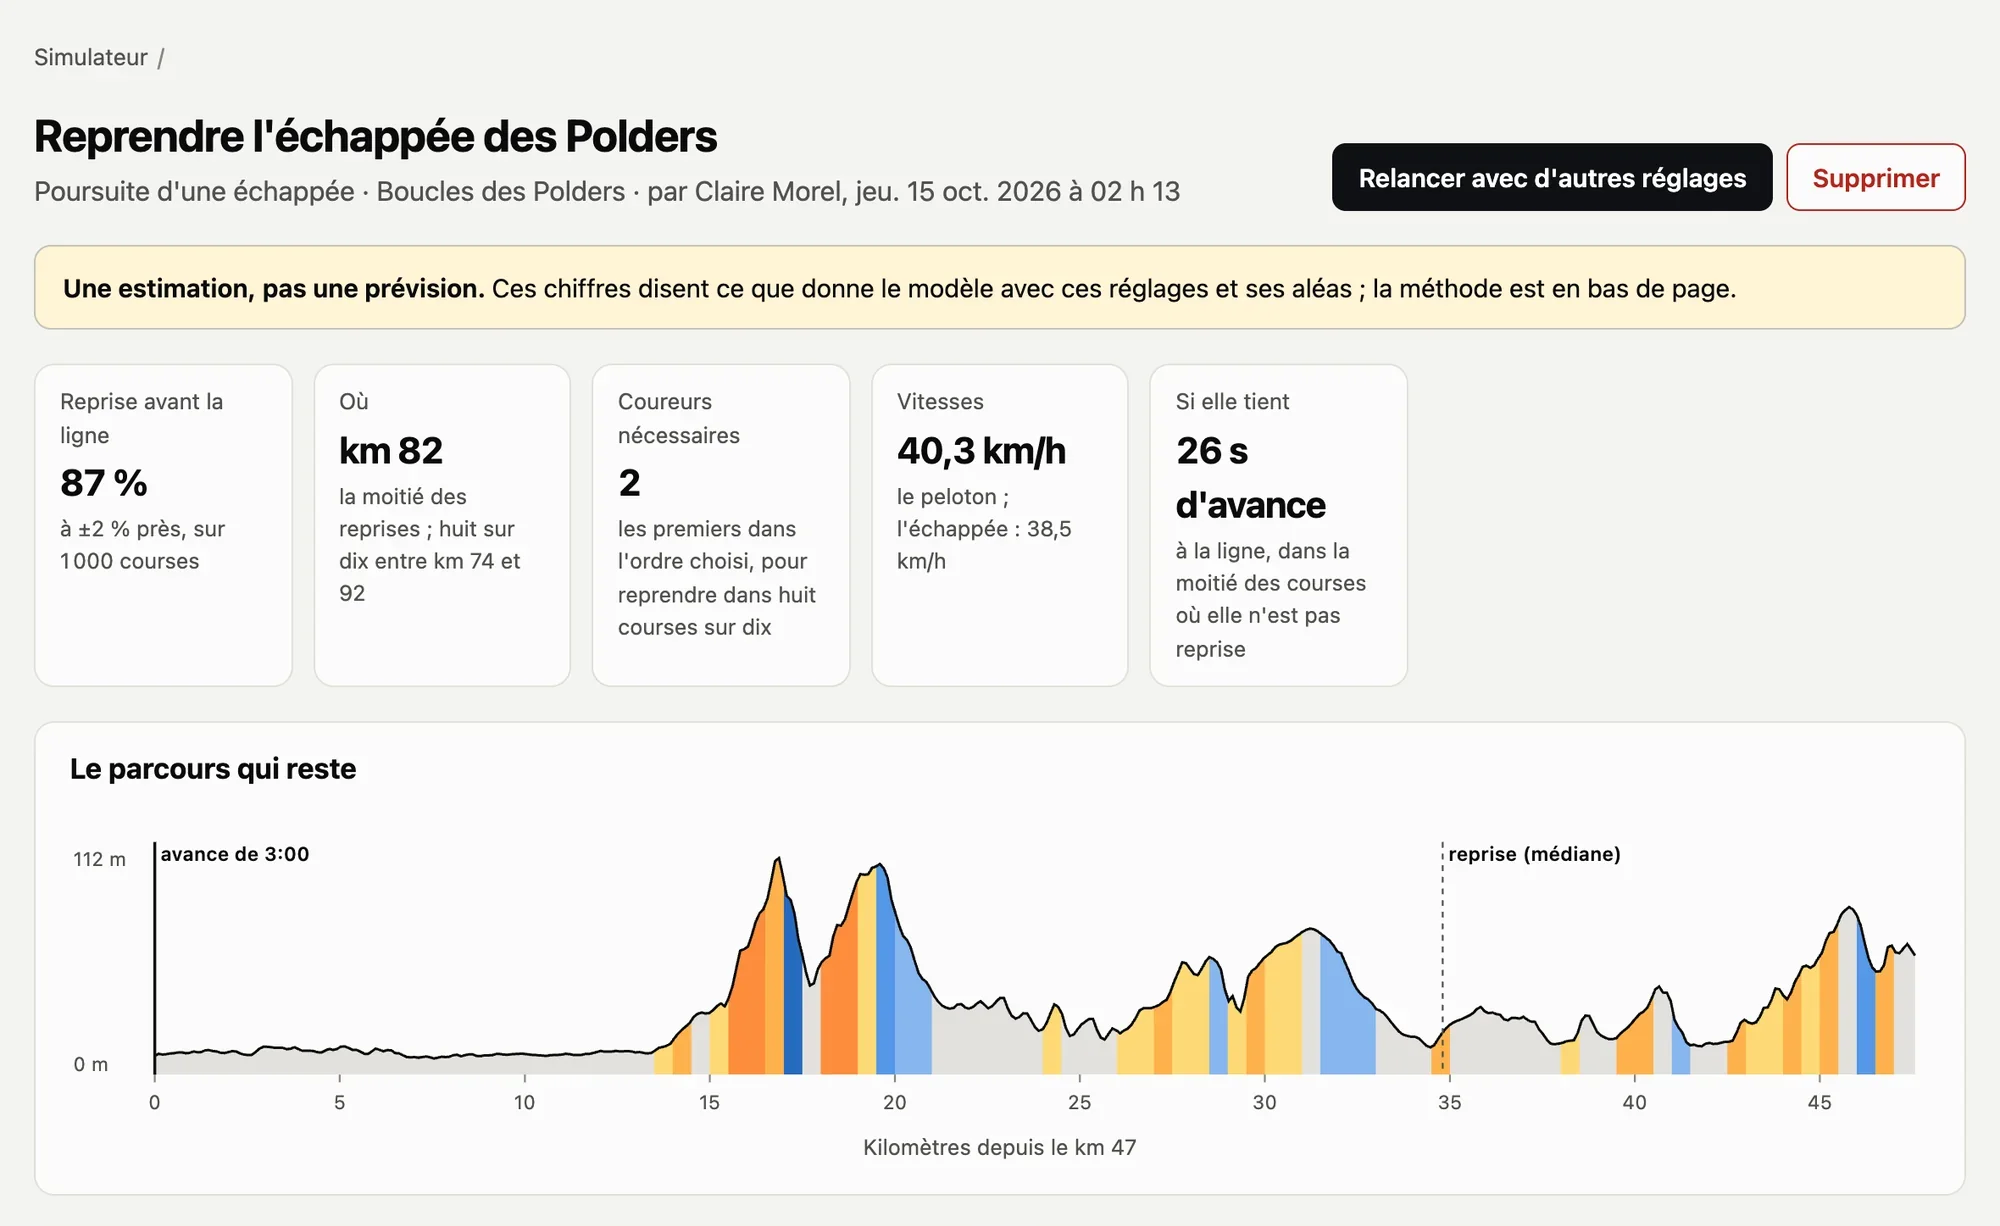
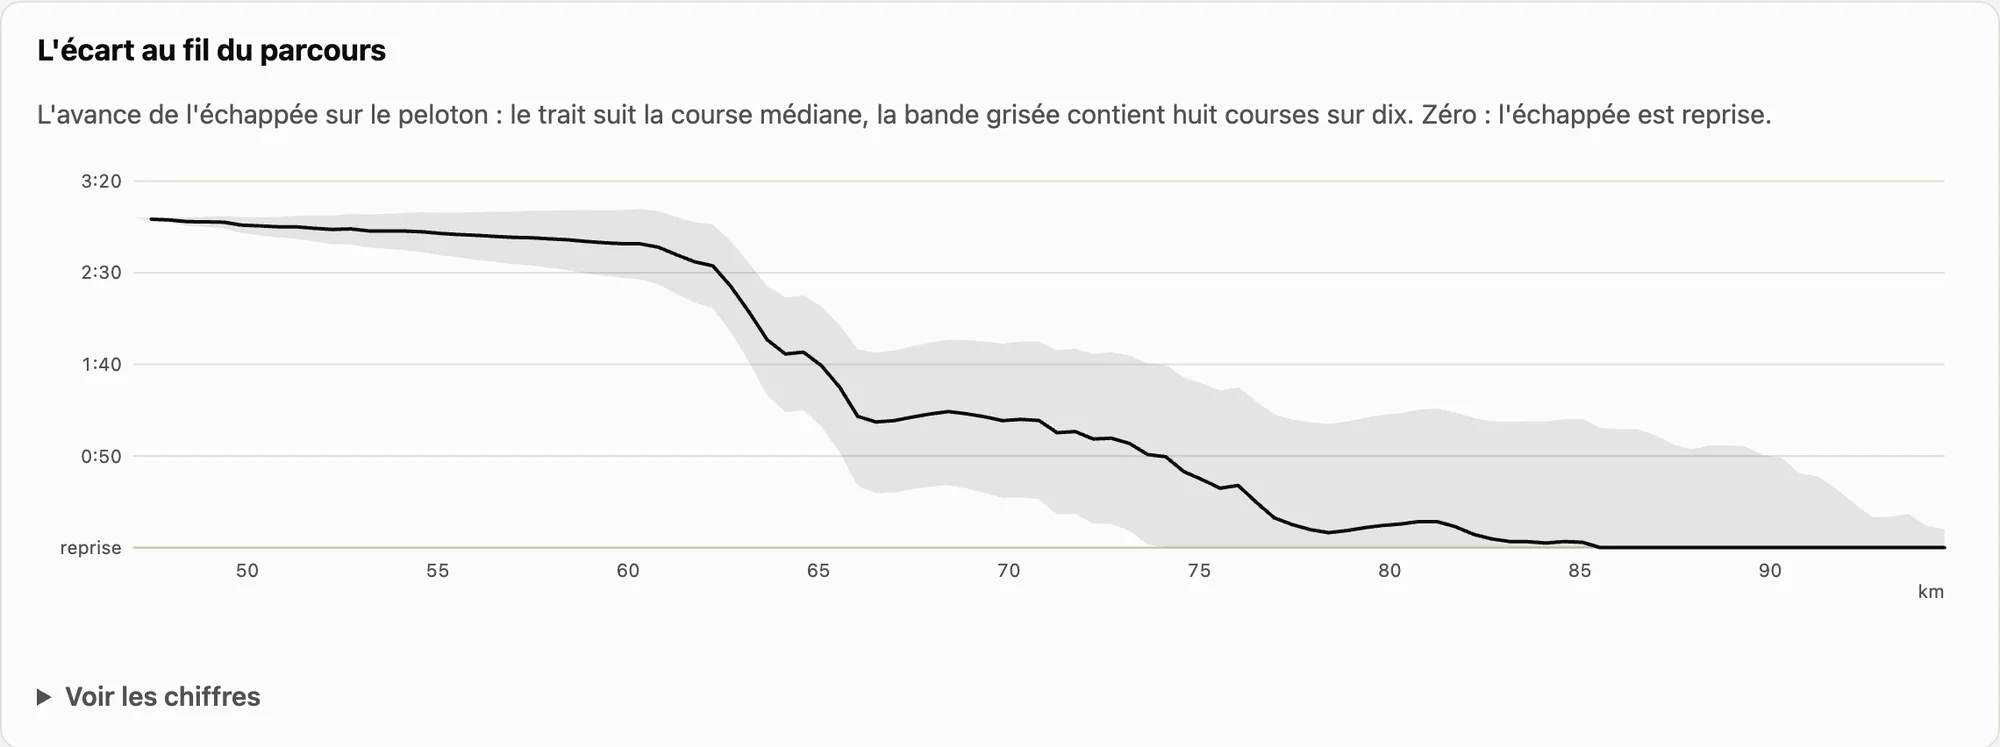
The ‘Bring back the Polders break’ simulation: caught before the line in 87% of races, with half of the catches made by km 82, with two riders; the profile of the rest of the route.
How many riders it takes to bring back the break: 9% with one chaser, 97% with two, 96% with three, 87% with four.
The gap along the route: the break’s lead over the peloton, the median race and the band covering eight races in ten.

Bringing back the Polders break. Caught before the line in 87% of simulated races; with two chasers, in 97%.

D−1

The road book

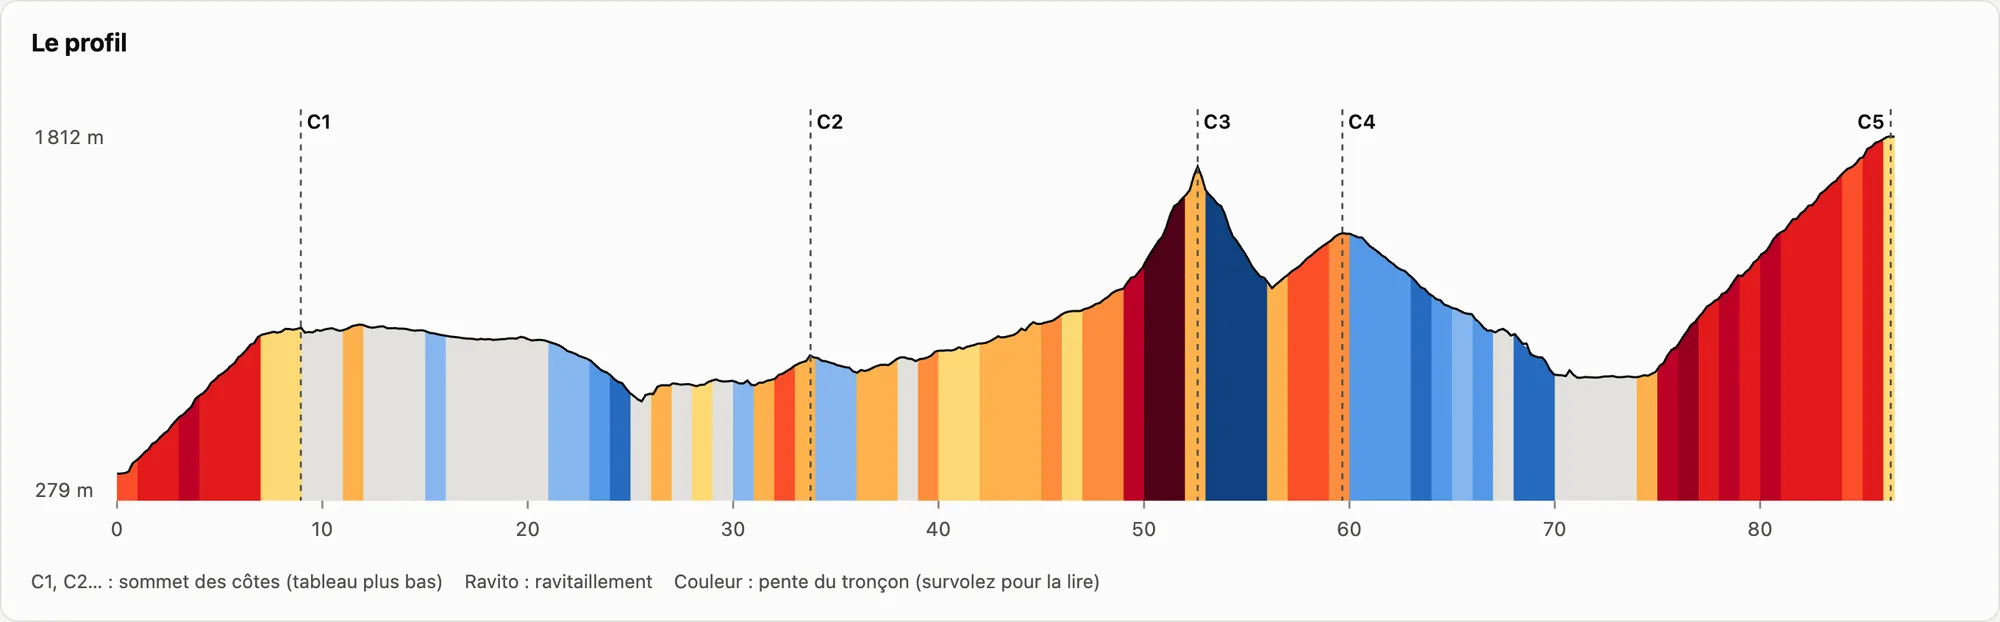
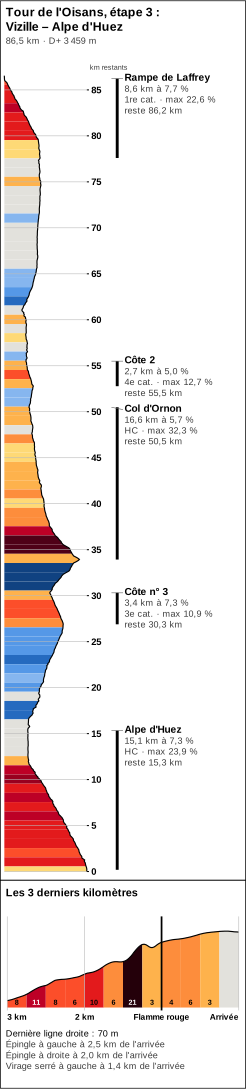
The road book is built from the route: climbs identified and categorised, dangerous bends, the finishing straight, sections exposed to echelons in the forecast wind. From it, the mechanic works out the gearing, the nutritionist the fuelling, and every rider tapes their stem sticker in place.

  • Wind and echelons, section by section
  • Gearing and wheels
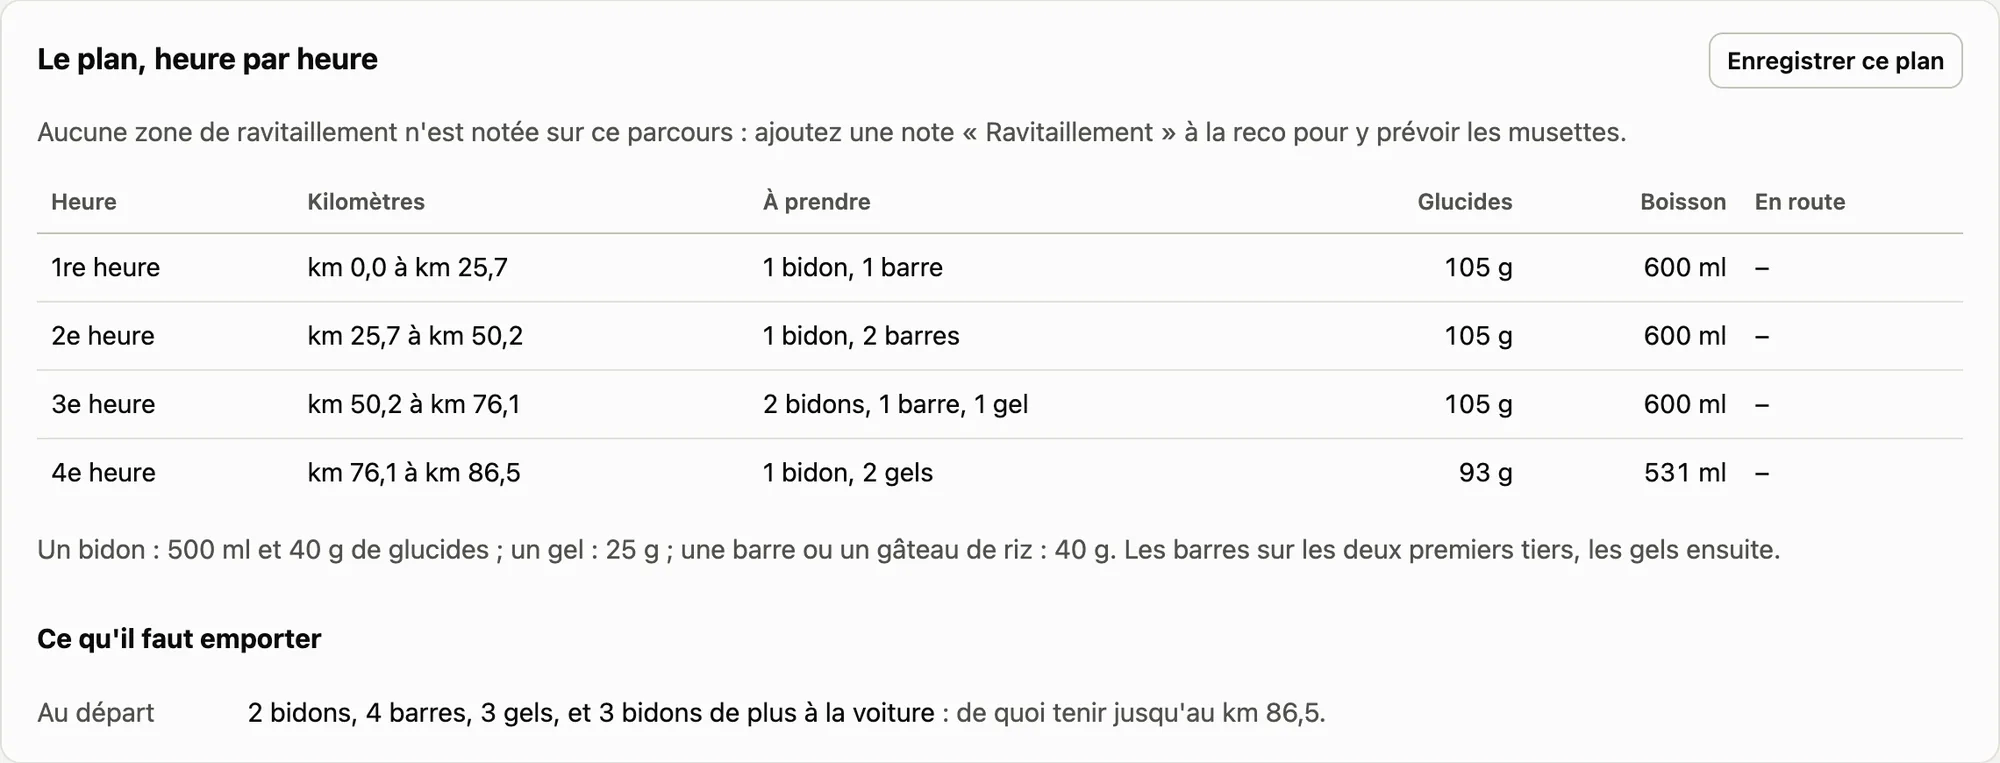
  • Fuelling plan, hour by hour
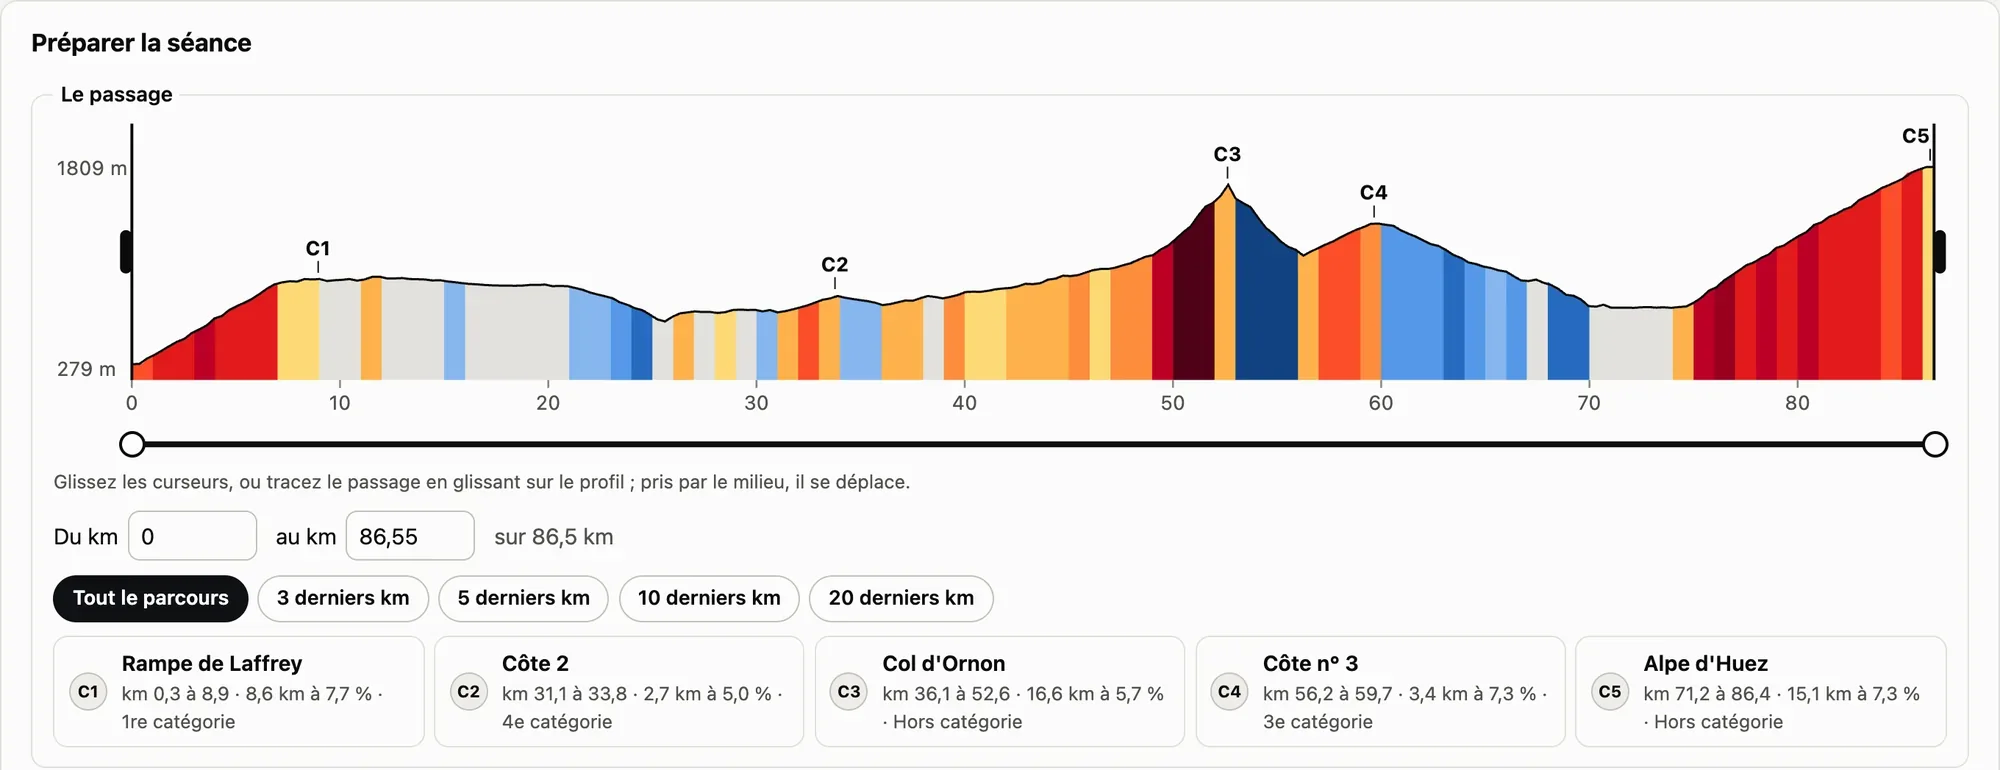
The road book profile: gradient in colour, with the summits of the five climbs marked C1 to C5.
The stem sticker strip: the stage profile running vertically, with the kilometres to go.
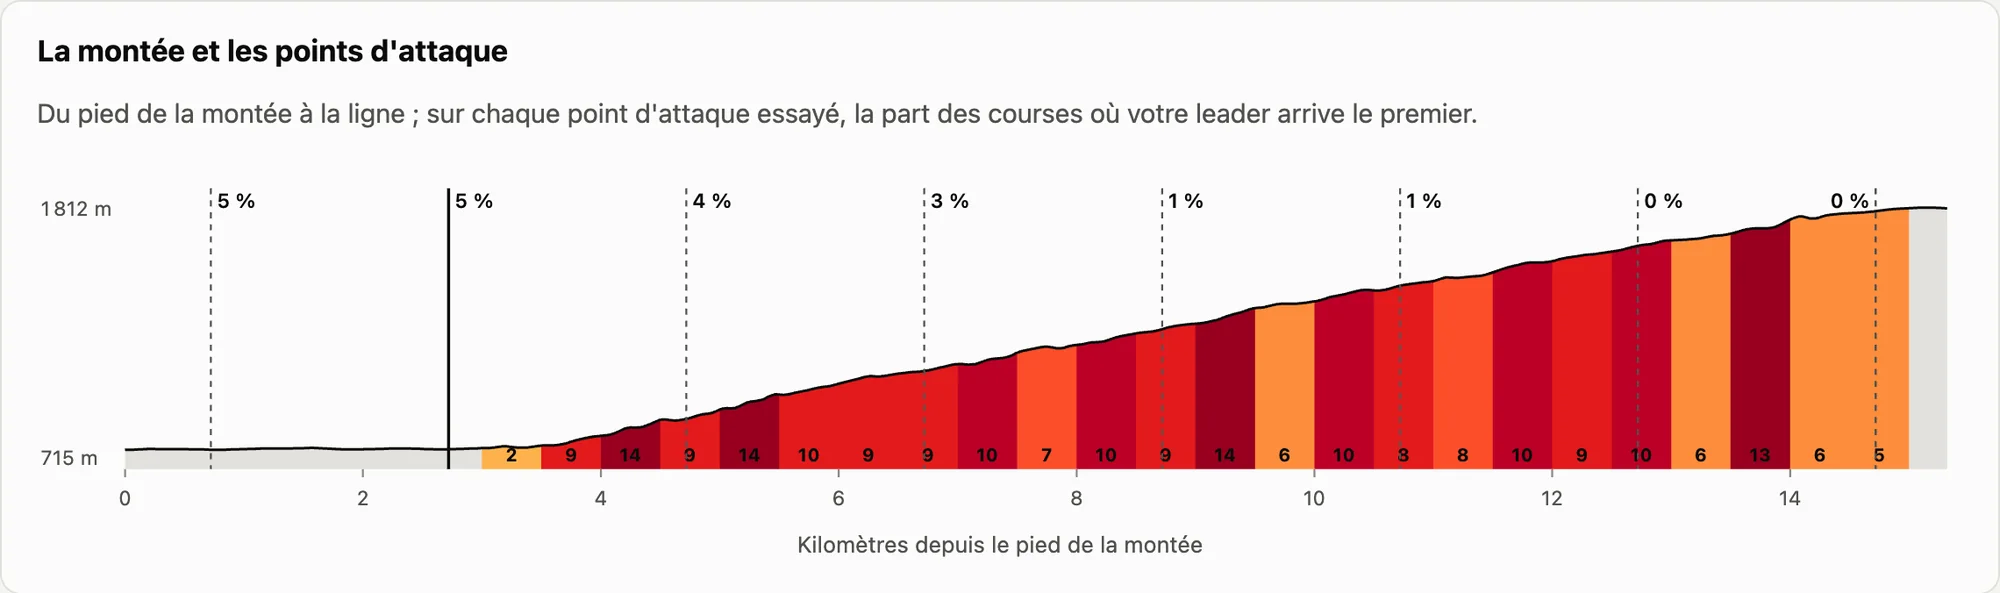
The climb to Alpe d’Huez and the attack points tried by the simulator, with the share of races won from each.

The profile, the stem sticker and the final climb. Printed on A4 at 100%, each strip is 65 mm wide; the numbers alongside are the kilometres to go.

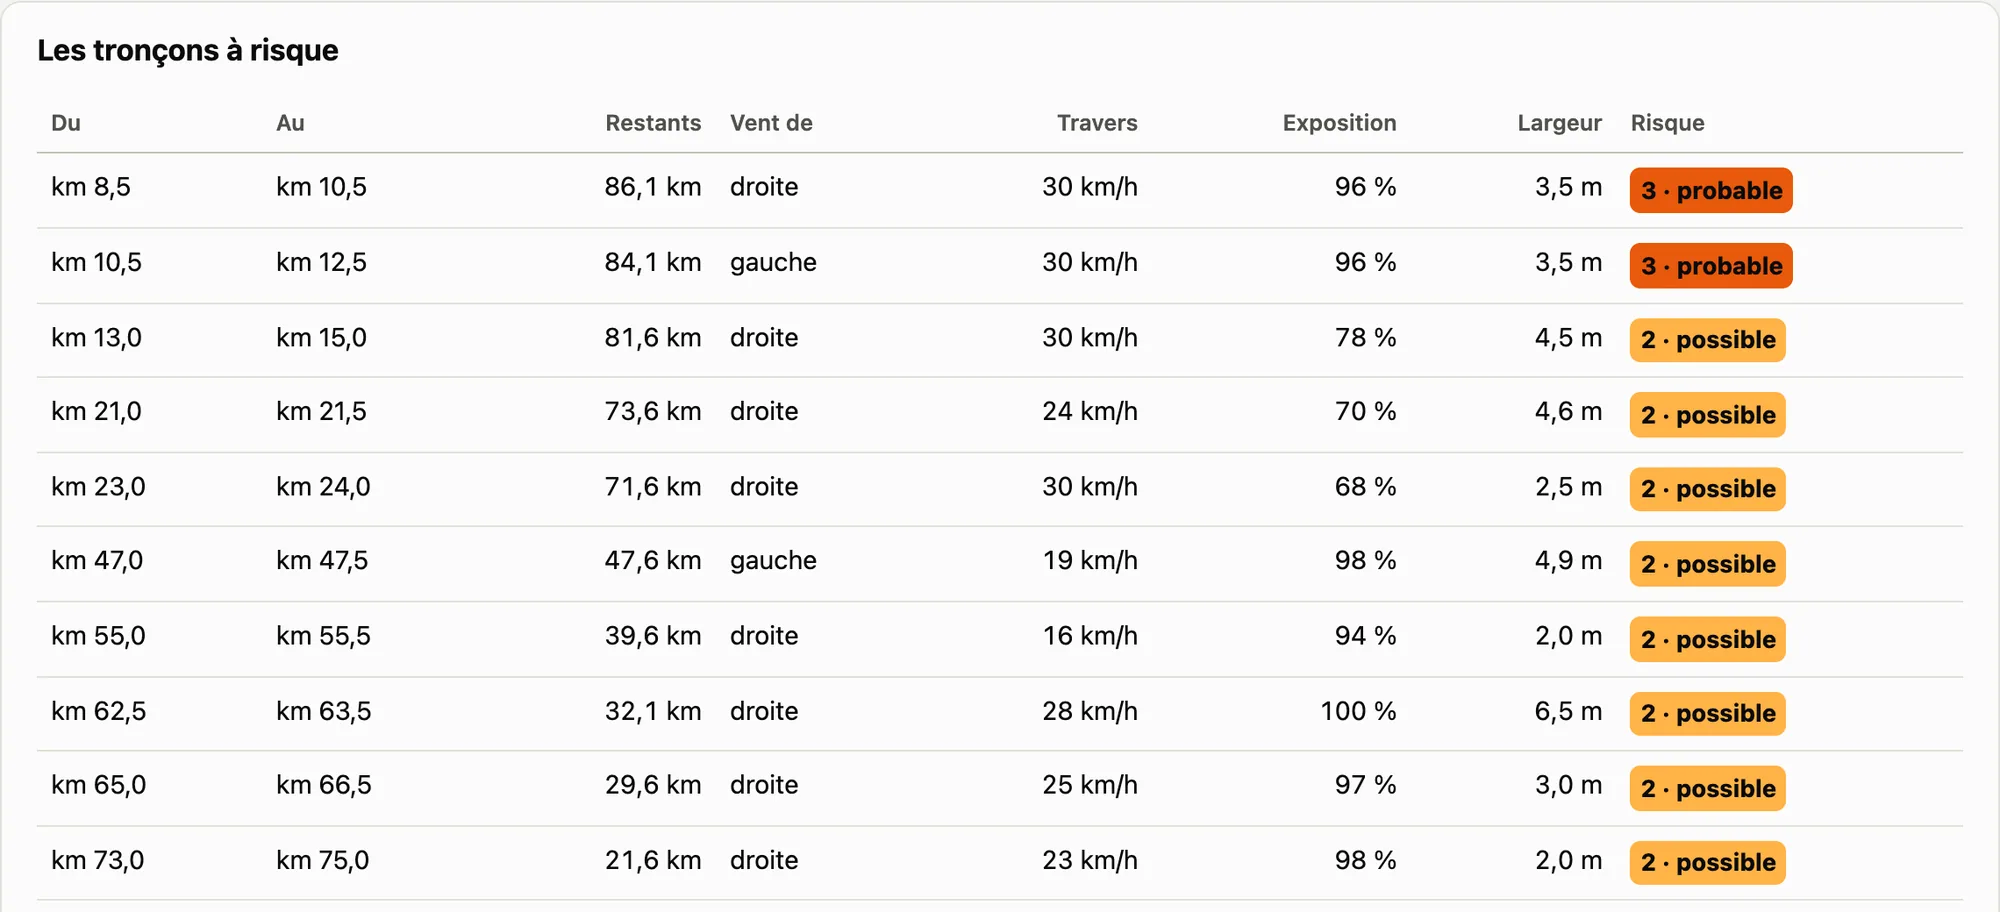
Sections at risk of echelons on the Boucles des Polders: kilometres, crosswind, exposure, road width and the risk level written out.
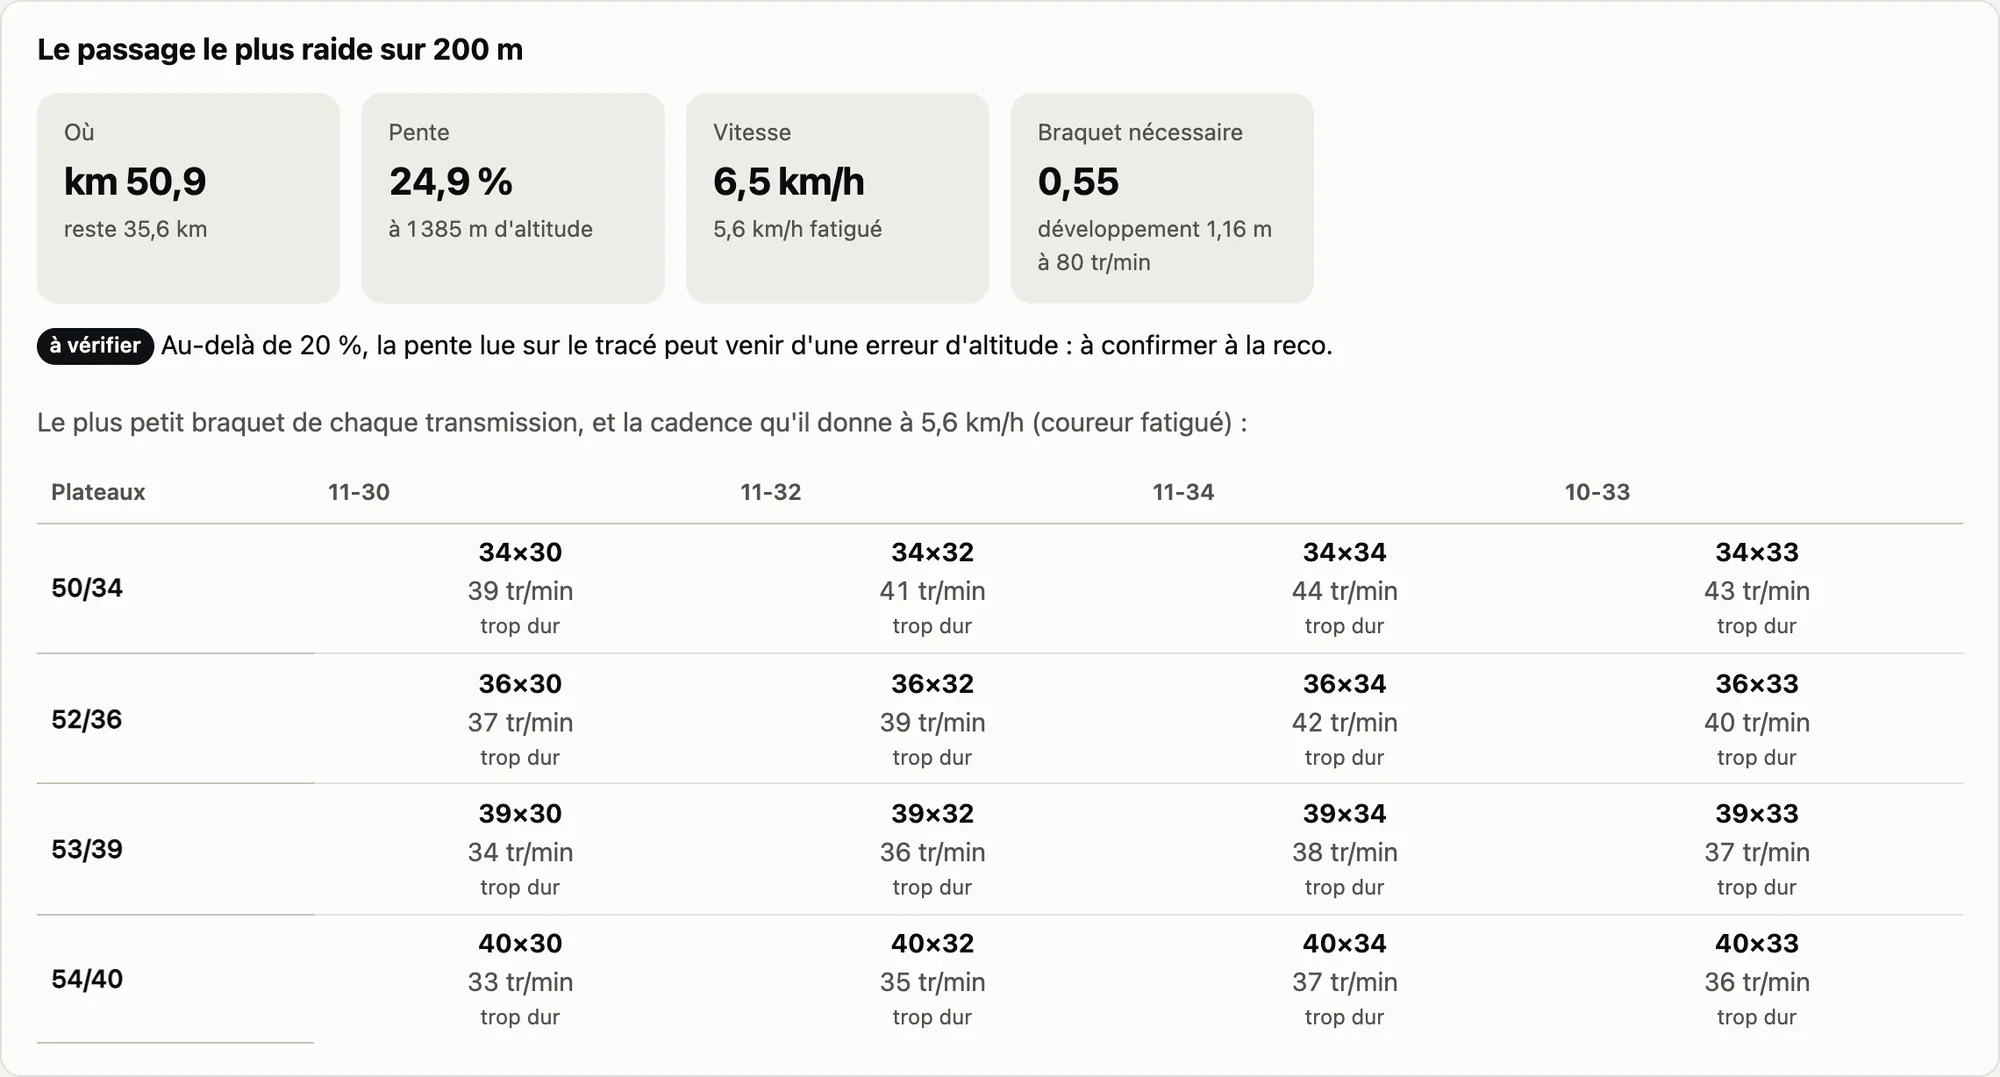
Gearing and wheels: the steepest 200 m, at 24.9%, and the cadence each gear gives.
The hour-by-hour fuelling plan: kilometres, bottles, bars and gels to take, carbohydrate and fluid.

Wind and echelons, gearing, fuelling. Each risk has its level written next to its colour; any section steeper than 20% is flagged ‘to check’ for the recon.

11:15

Live

In the car, the co-pilot follows the riders along the route. It calls out the next climb, the next feed zone, upcoming recon notes and the crosswind over the next ten kilometres. It can be rehearsed the day before on a race replay, at ten times speed.

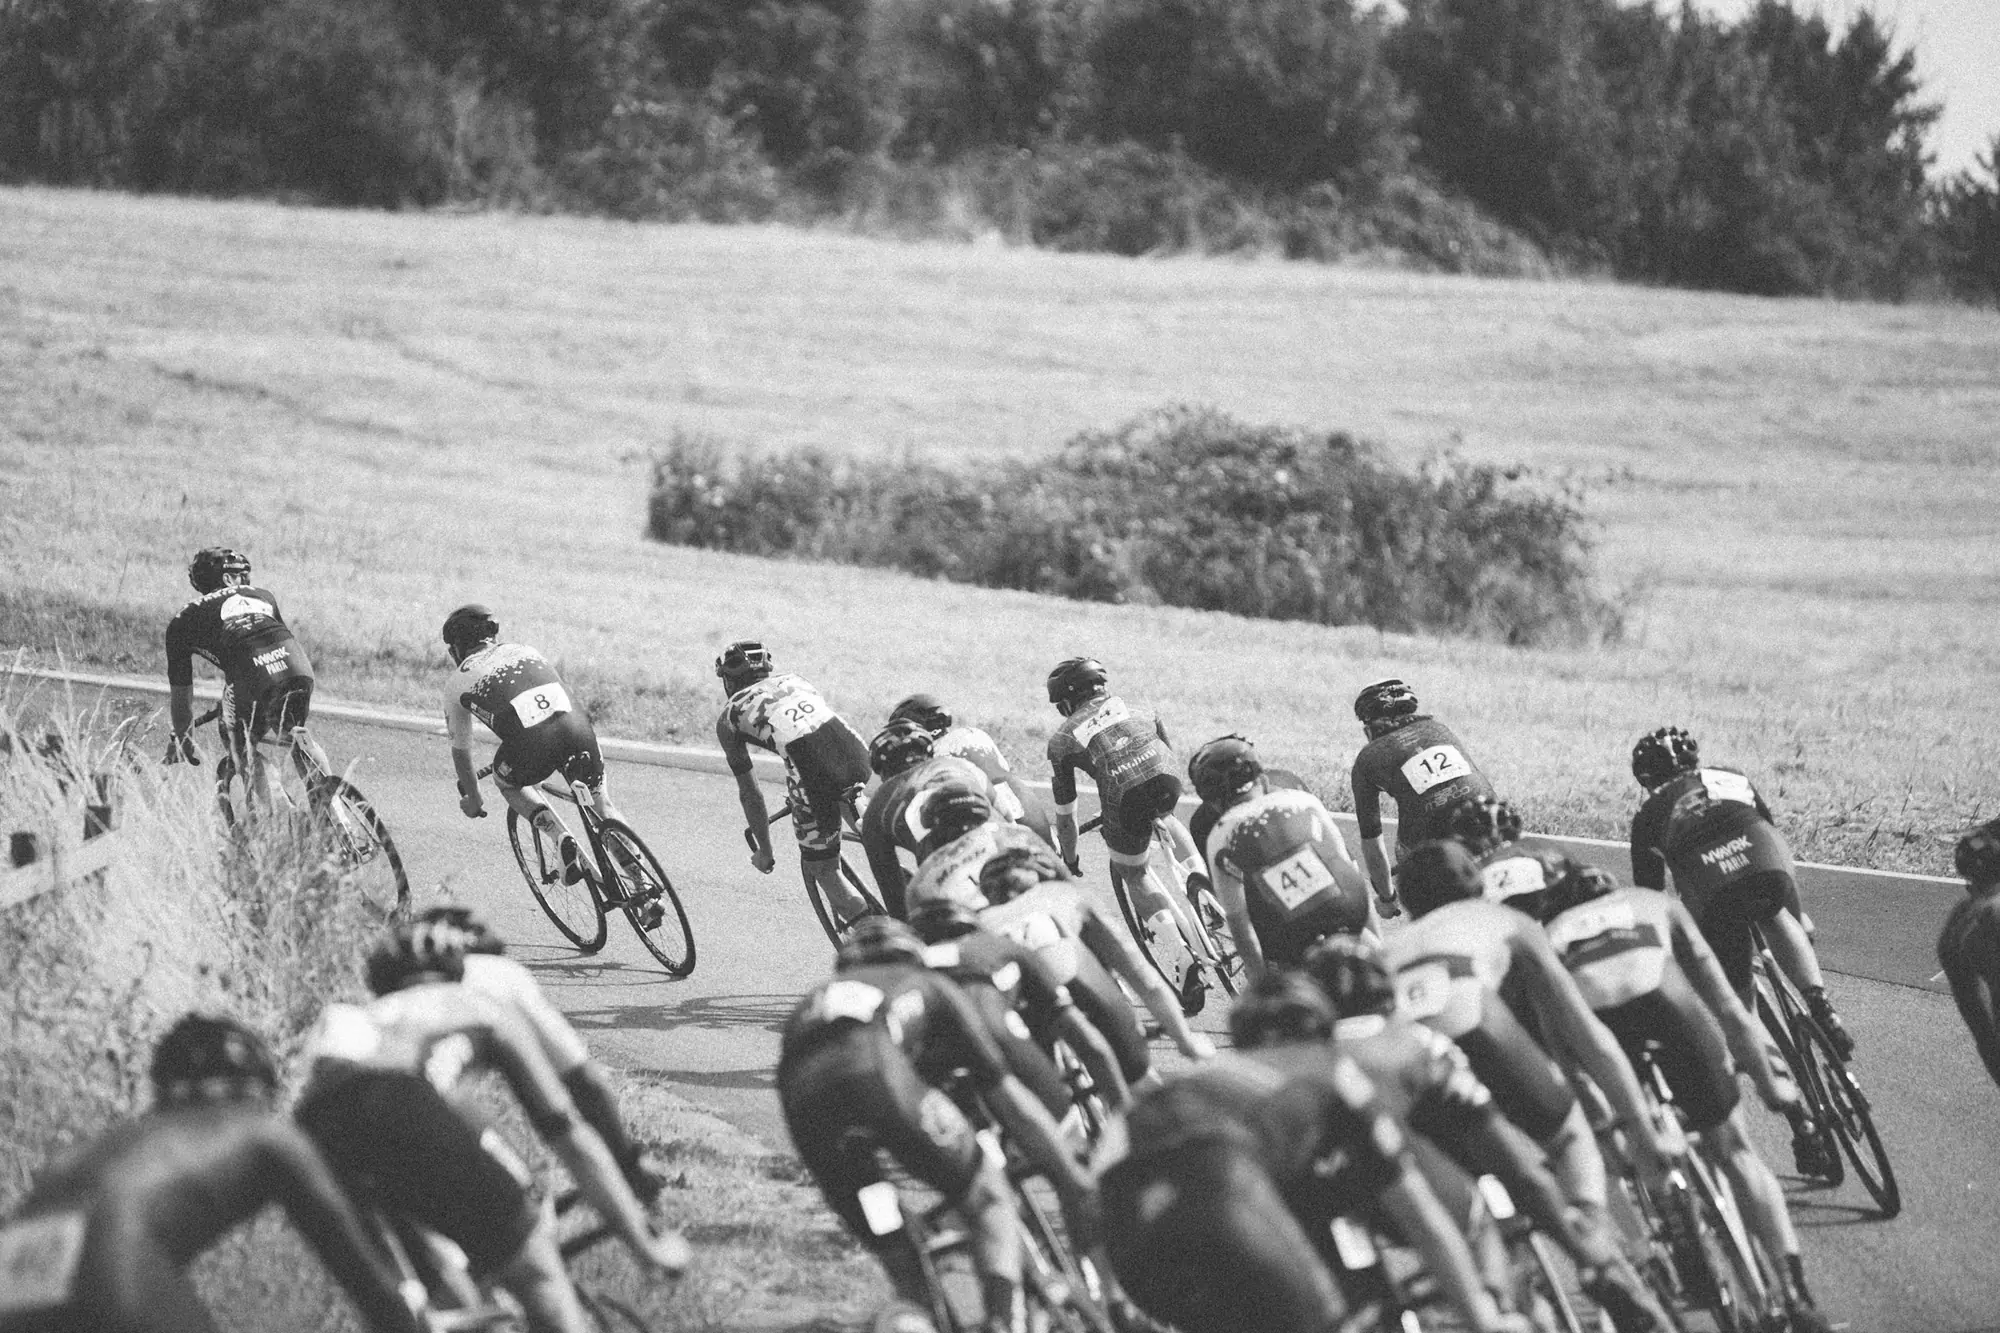
A peloton seen from behind on a bend, in black and white. Photo: Jonny Kennaugh, Unsplash
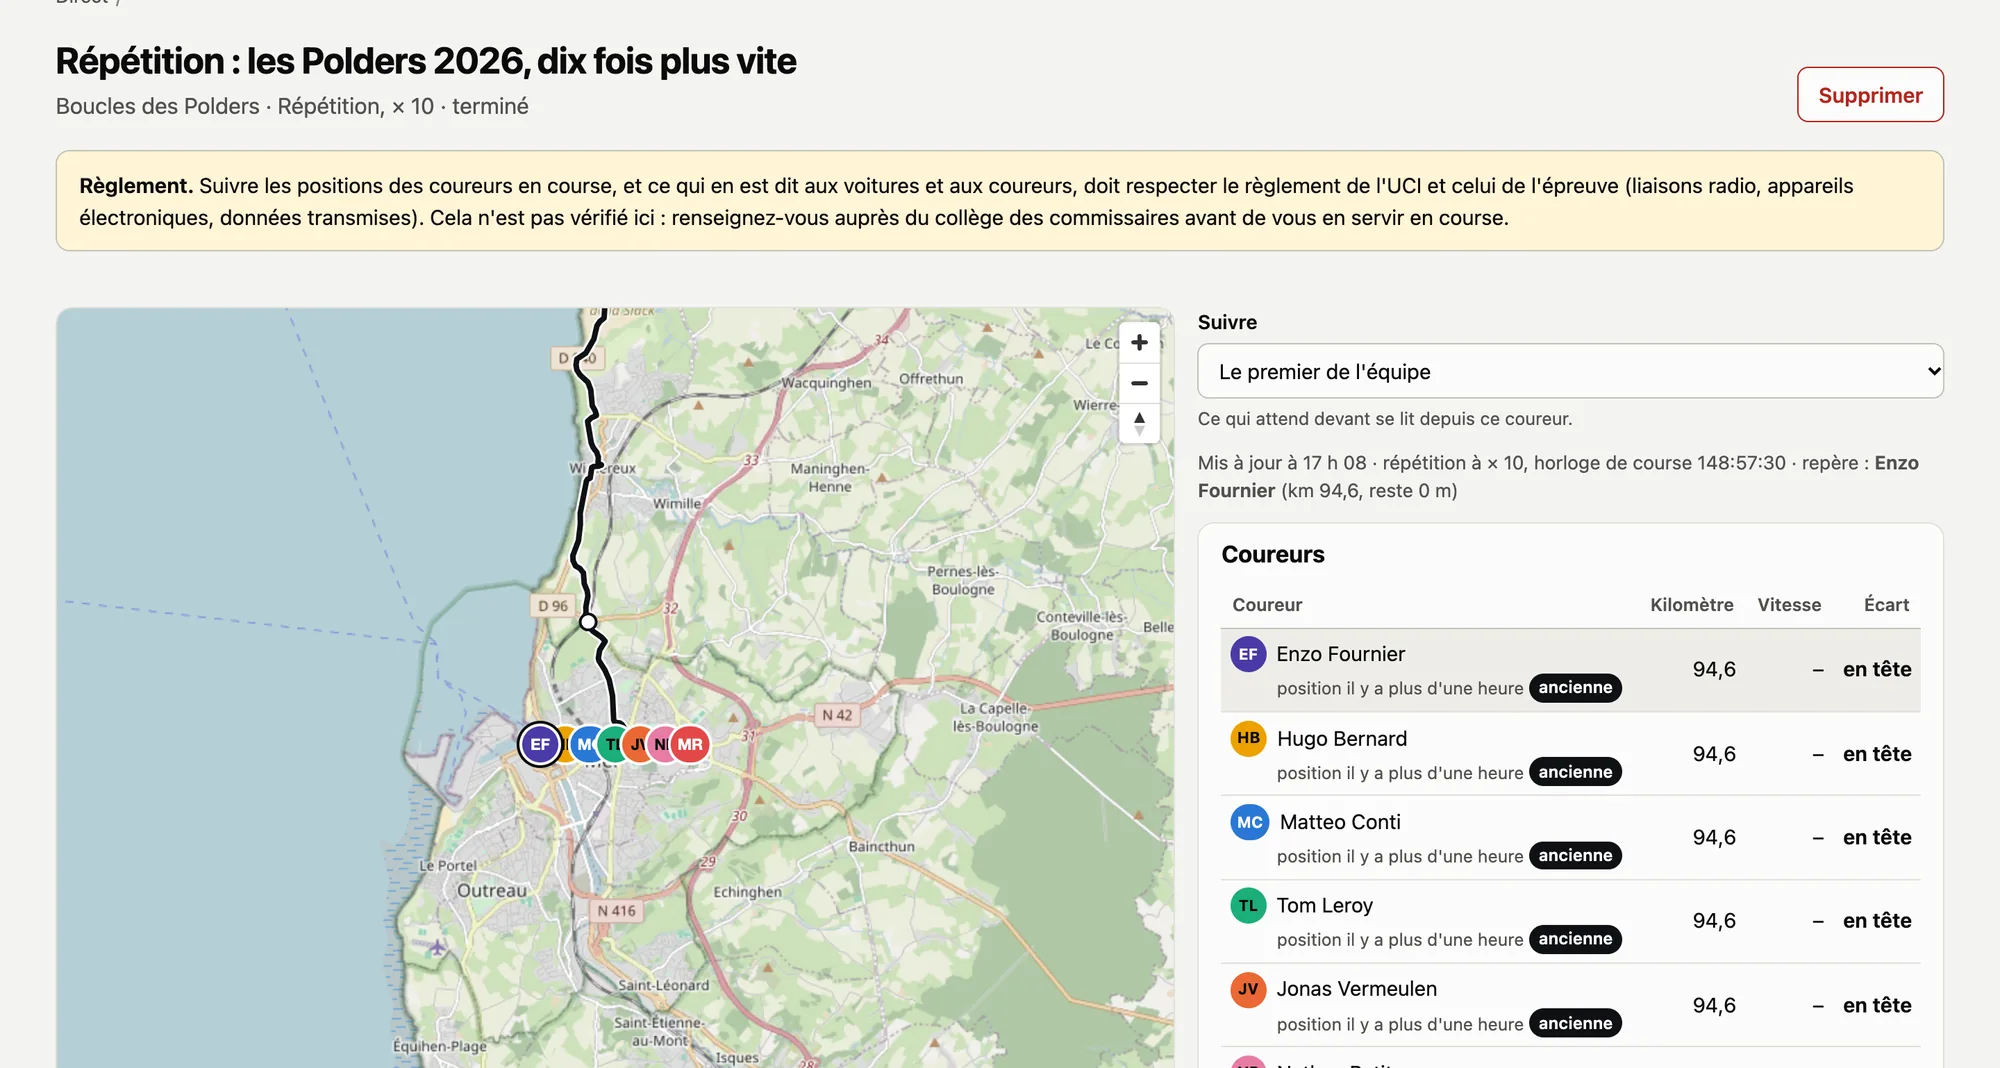
The live co-pilot: the map with the riders, the list of riders with their kilometre and gap, the next climb and the next feed zone.

The co-pilot, in rehearsal. UCI regulations and the race’s own rules govern communications and devices in racing; every live page says so.

That evening

The debrief

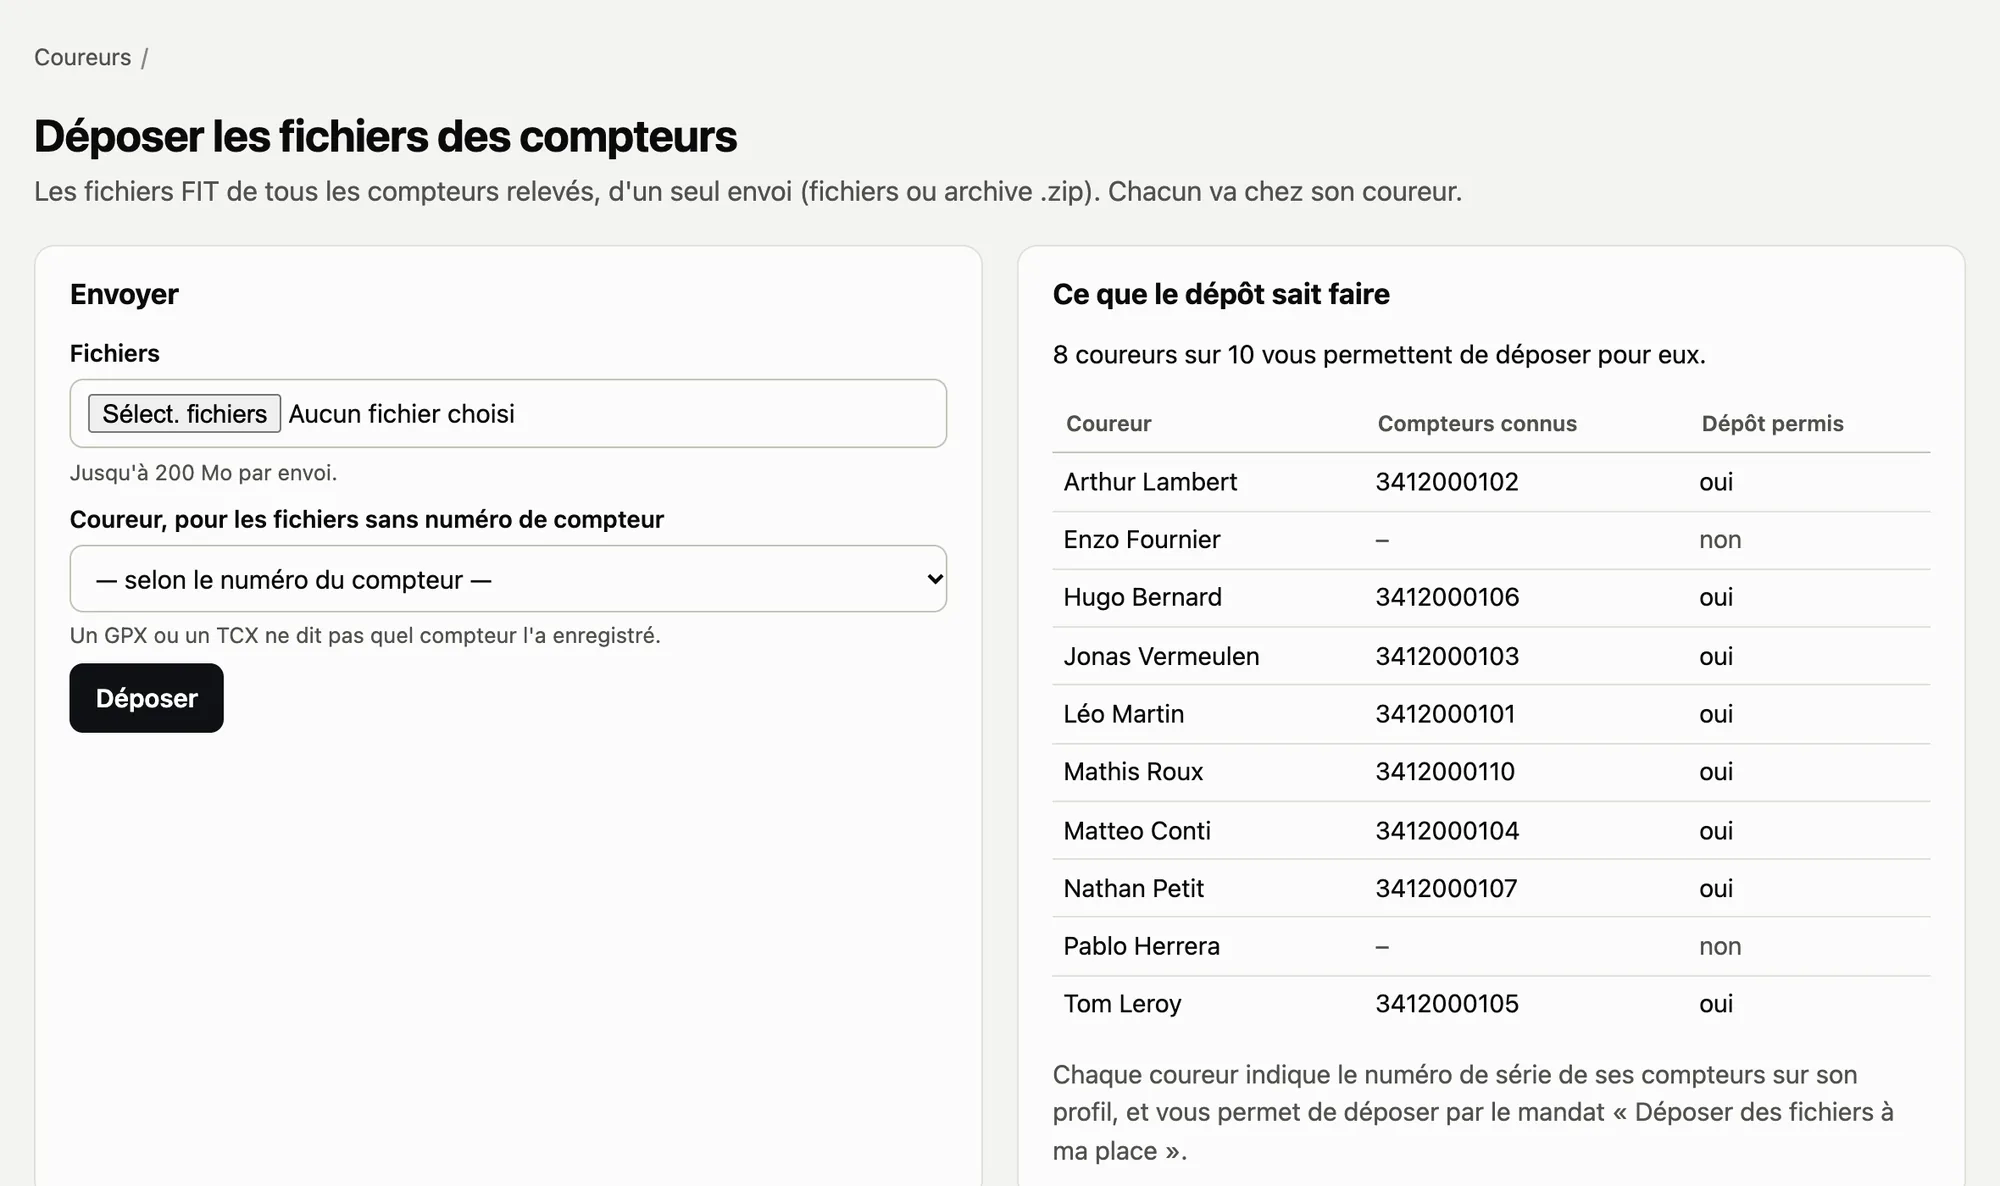
Staff upload the files from every bike computer in one go; each one is filed under its rider by serial number. The race is replayed, and explained: who was in the wind and for how long, who led out the sprint, how each rider took the bends on the descent.

  • Video synchronised with the race
  • Bus mode, controlled from a tablet
  • Public link, with the riders’ consent
A group of riders at full speed, in black and white, in a motion blur. Photo: Nico Knaack, Unsplash
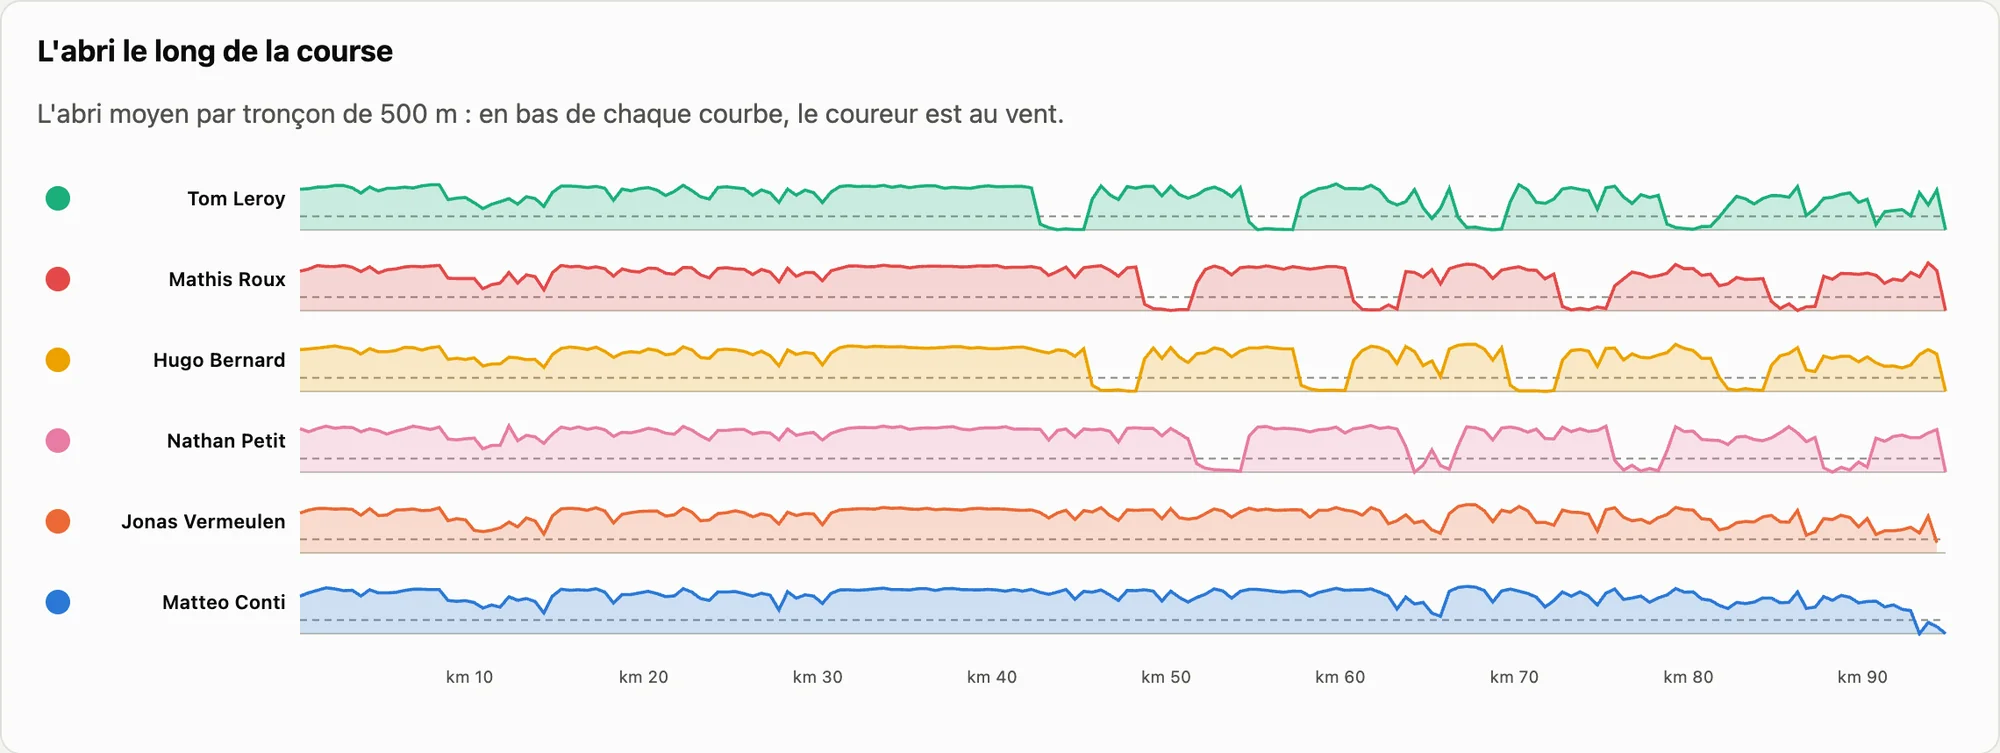
Shelter through the race: one band per rider over 95 km, which drops when the rider is in the wind.
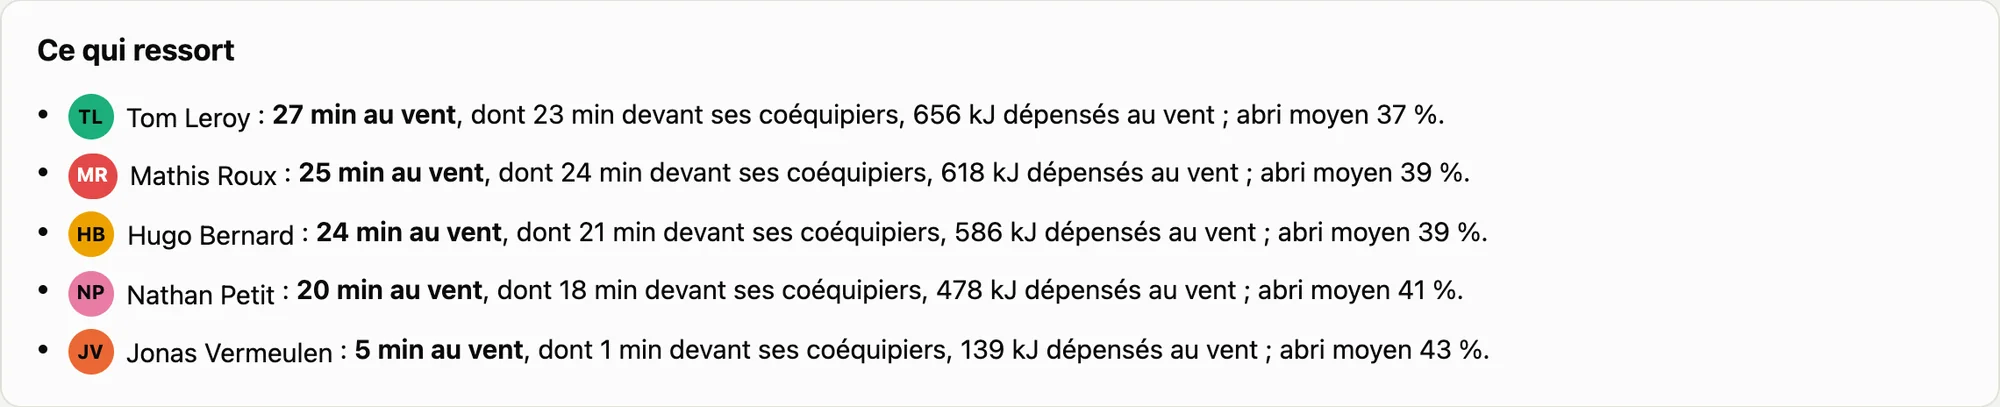
What stands out: Tom Leroy 27 minutes in the wind, 23 of them in front of his teammates, Mathis Roux 25 minutes, Hugo Bernard 24 minutes, Nathan Petit 20 minutes.
The bike computer upload: a single upload, each file filed under its rider by the serial number of their computer.

Who did the work, and the bike computer upload. Each rider’s shelter is estimated second by second, from their power, speed and position in the team. At the bottom of the curve, they are in the wind.

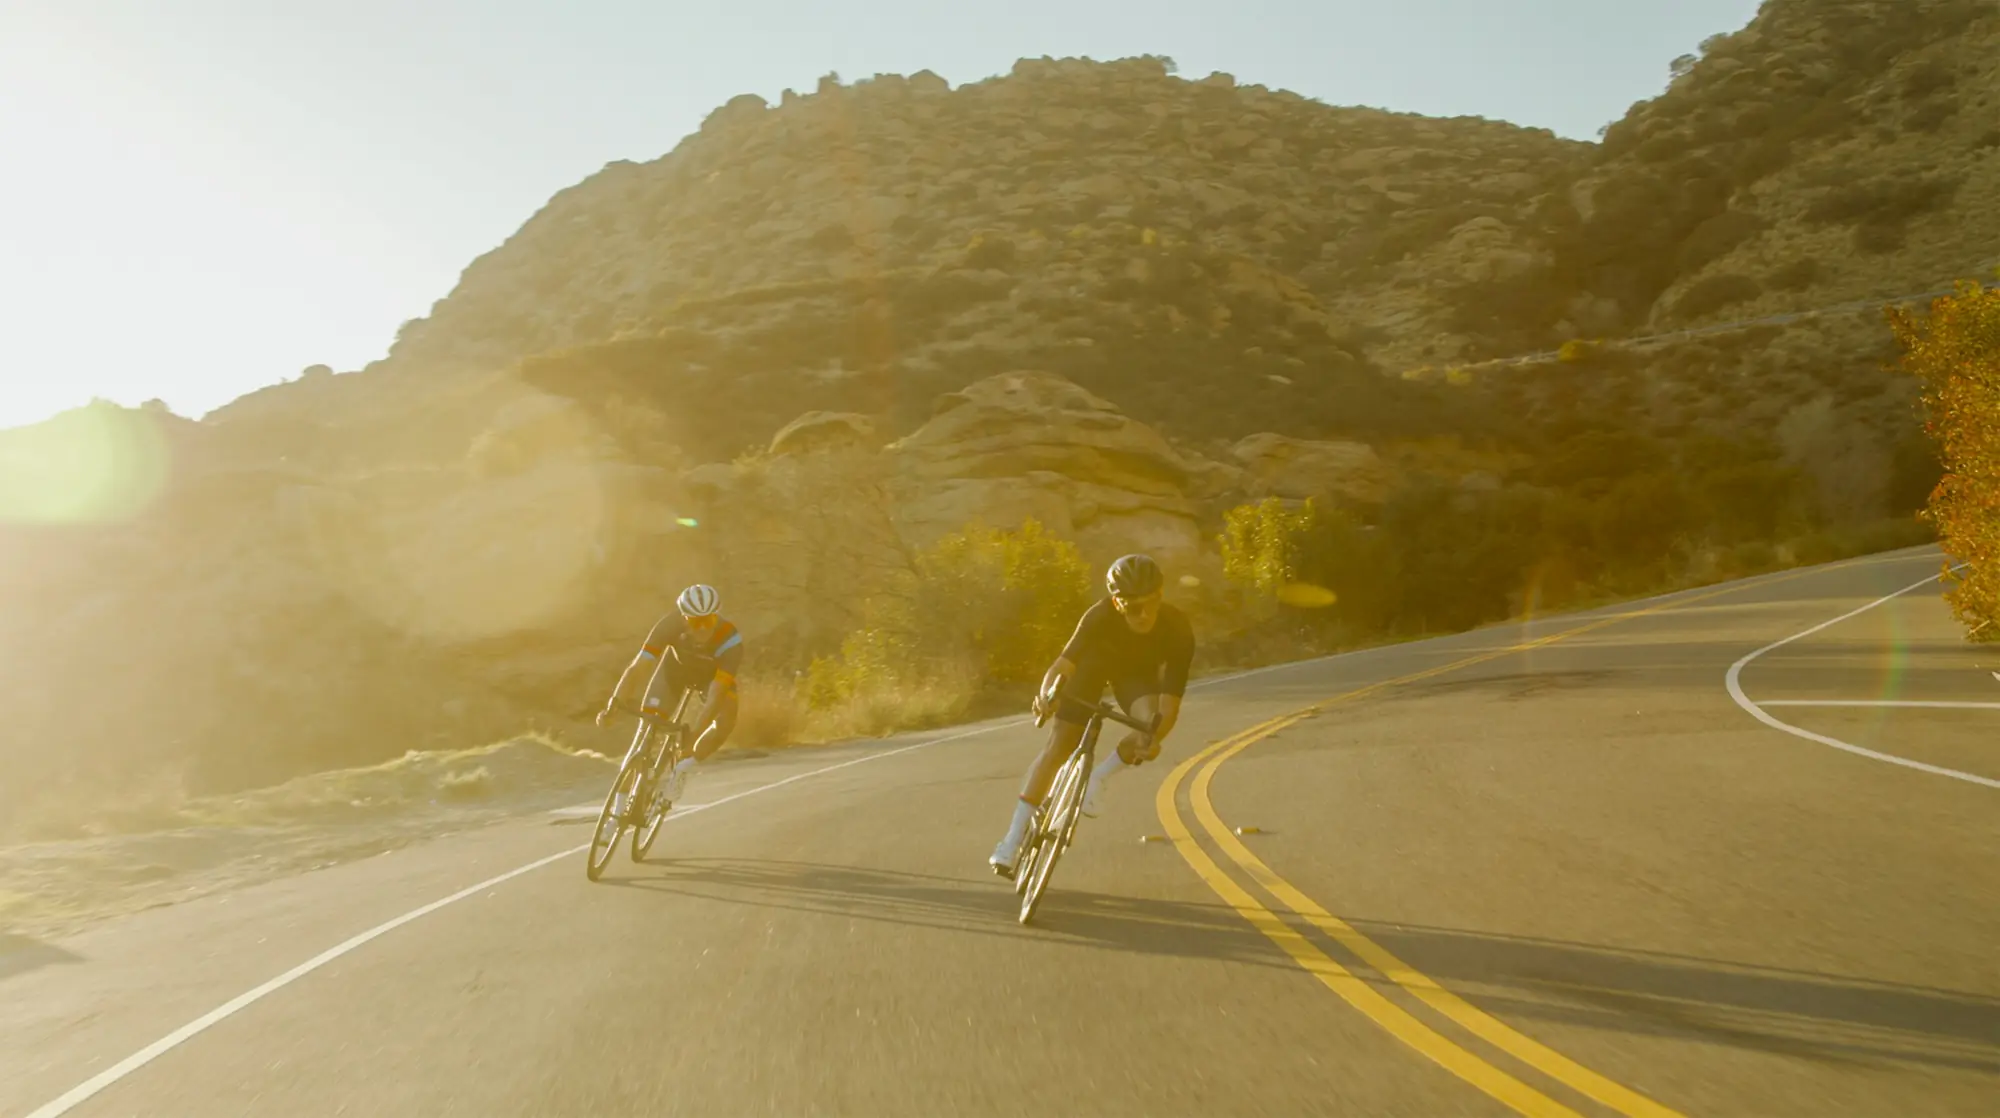
Two riders on a curving descent, backlit.
Every bend, rider by rider.
Photo: Jack Delulio, Unsplash
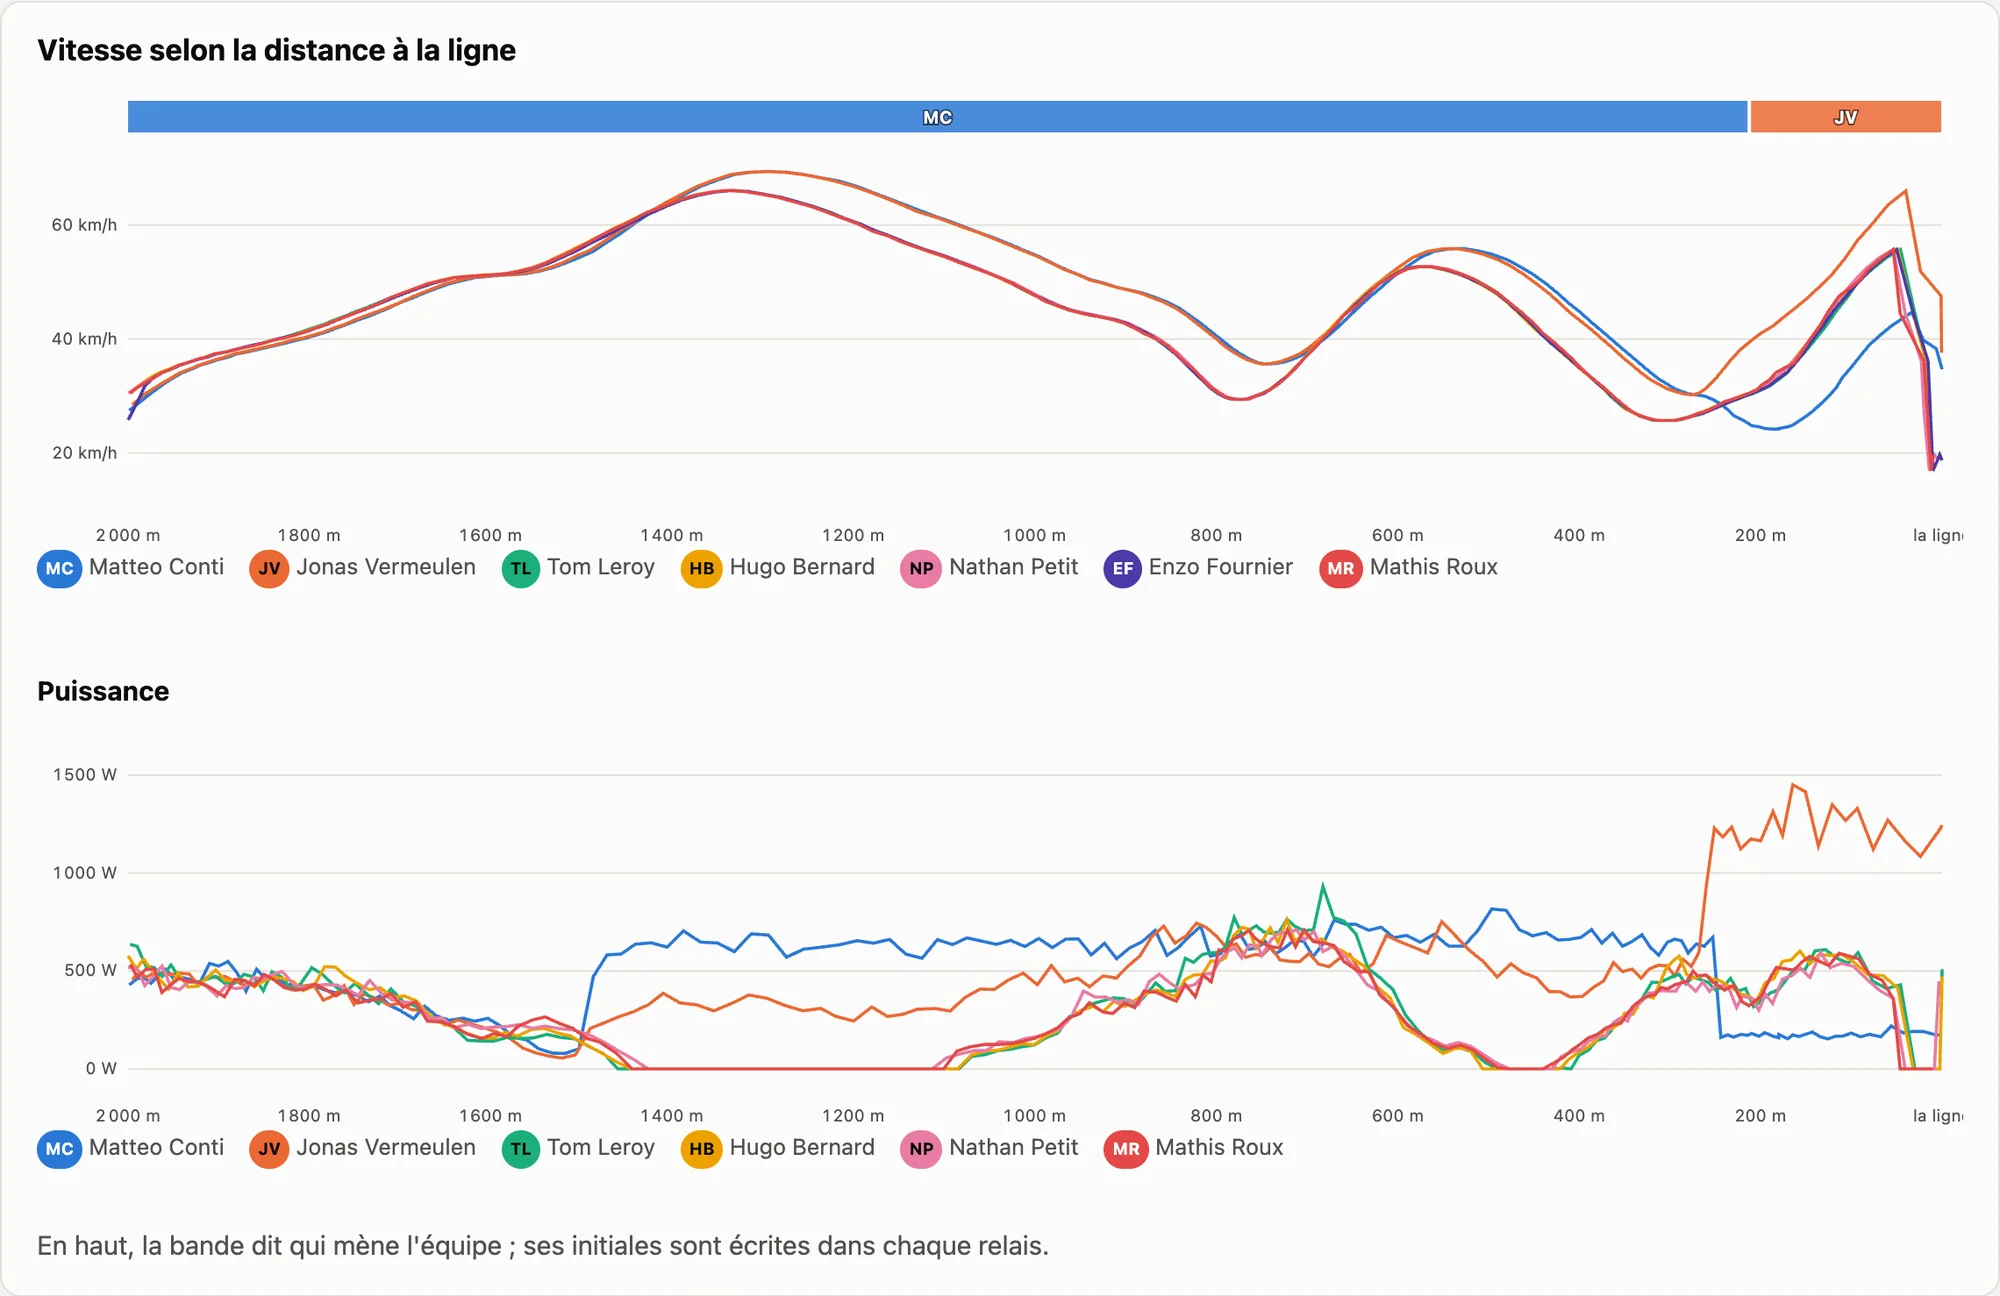
The sprint: each rider’s speed and power over the last two kilometres, with a band showing the turns on the front.
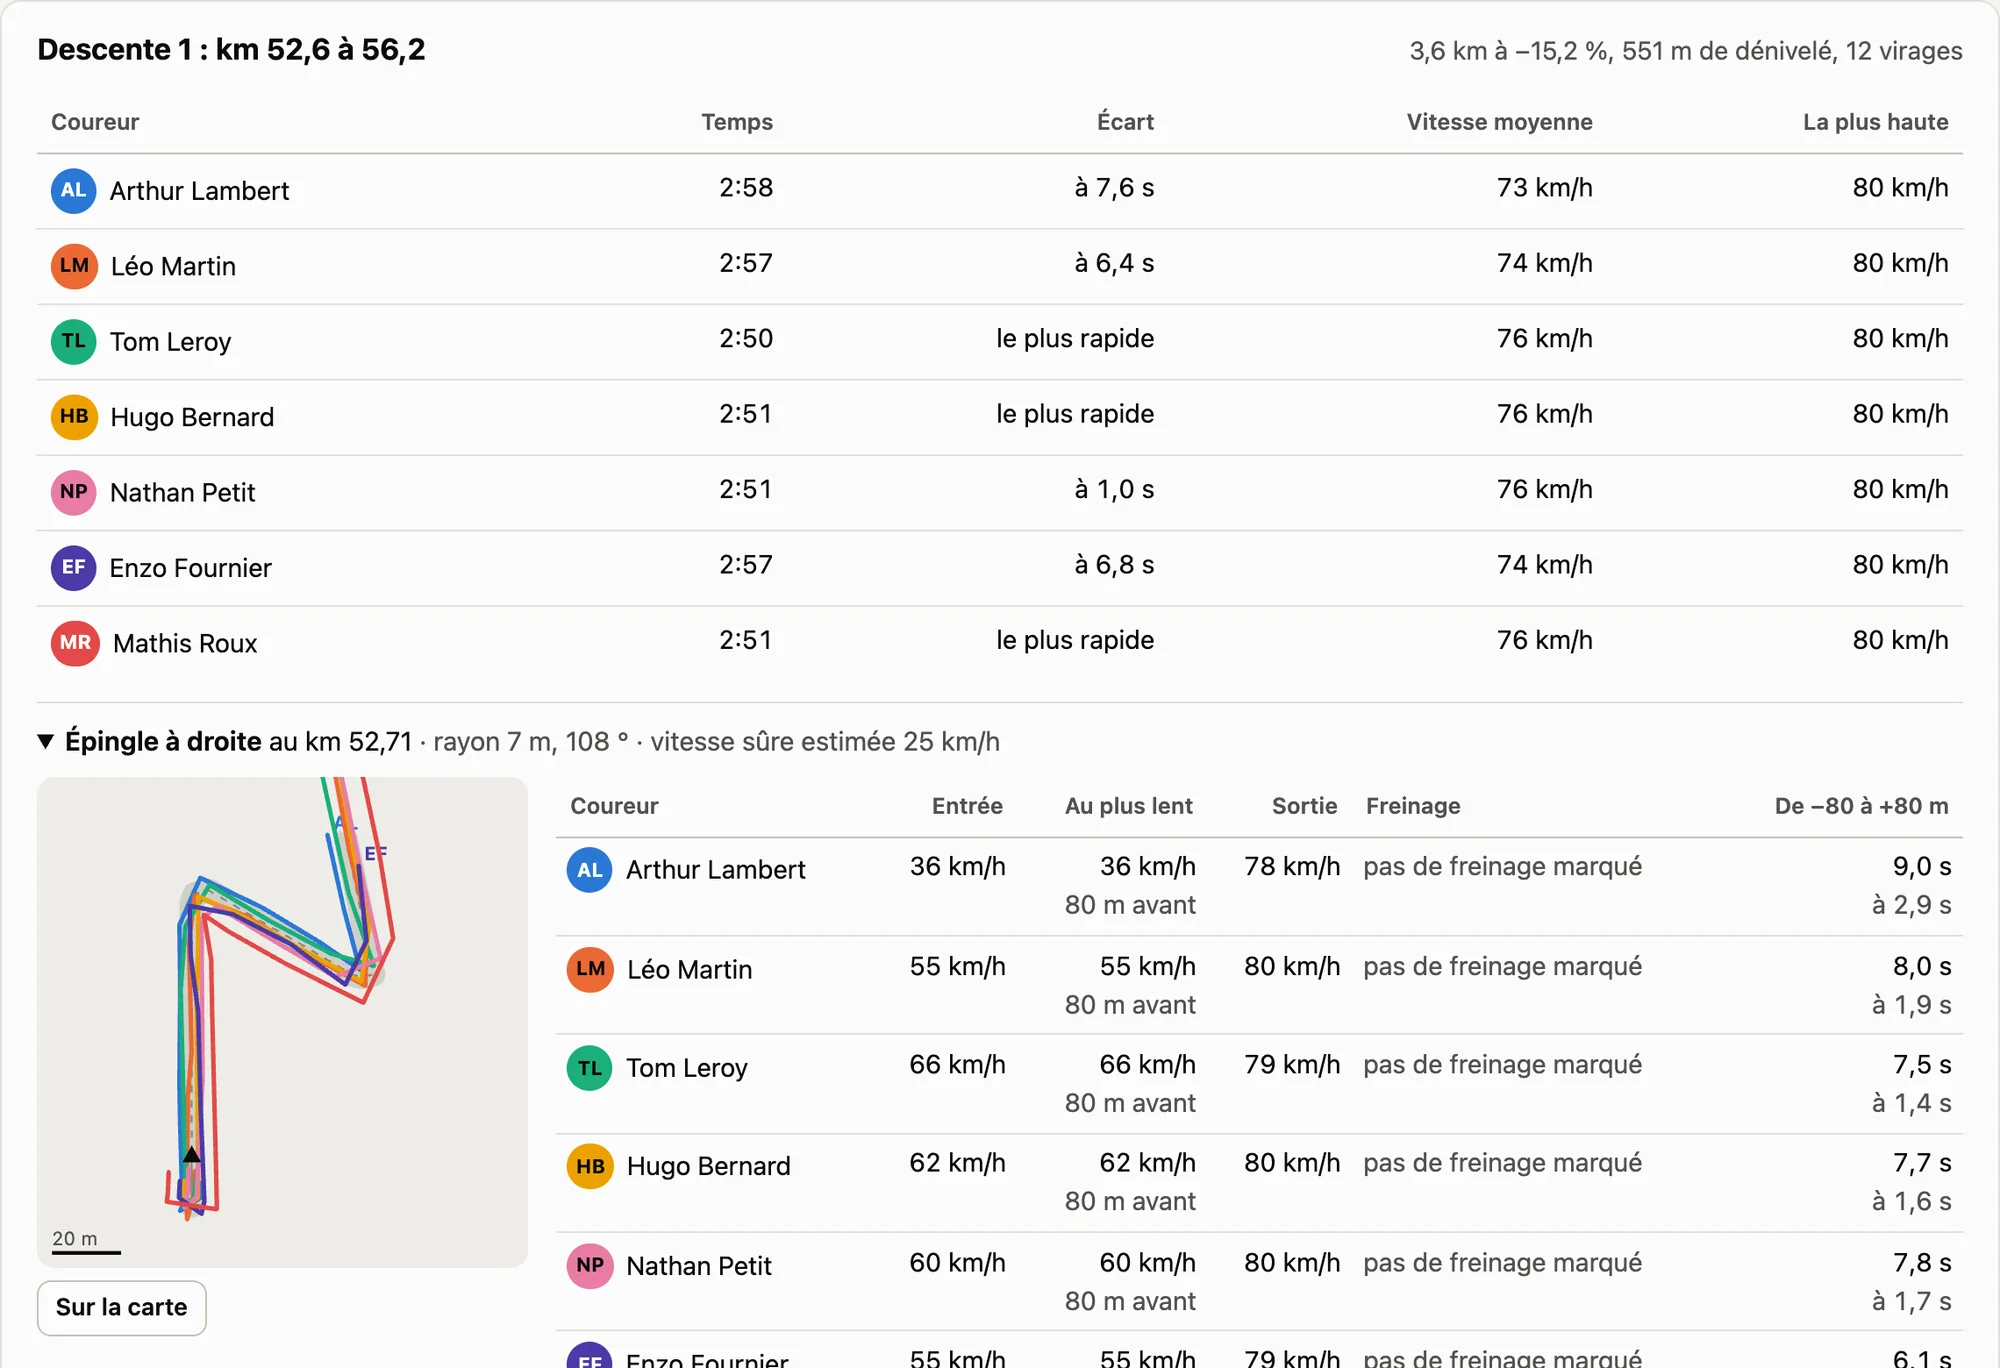
A descent off the Alpe: times for each rider, then the plan of a hairpin with seven riders’ lines overlaid.
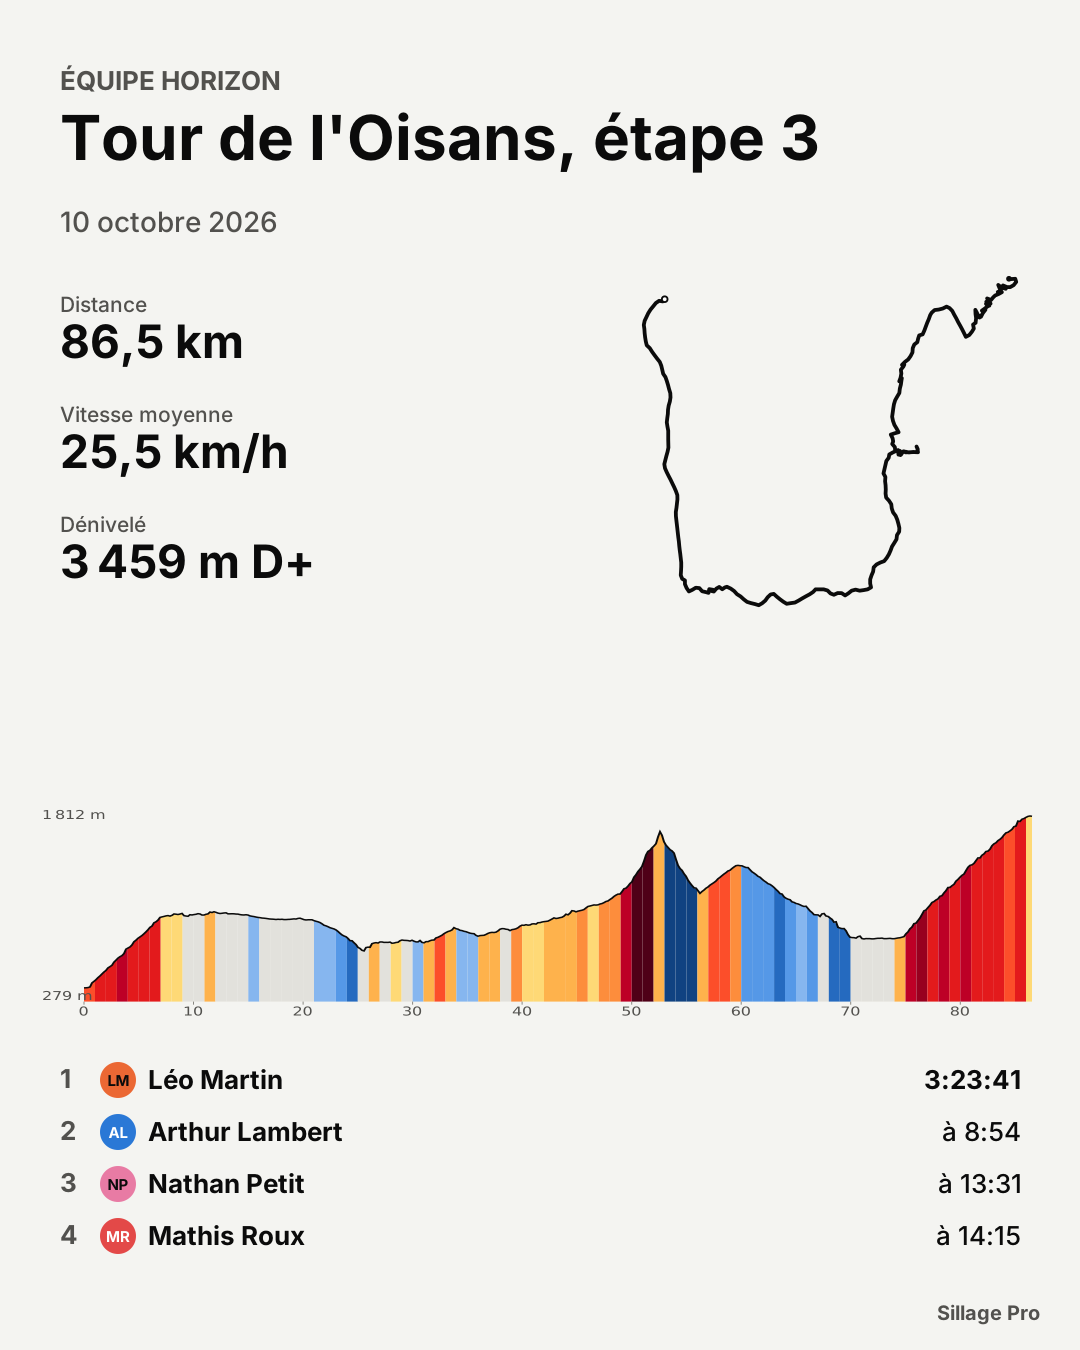
The stage graphic: distance, average speed, elevation gain, route shape, profile and the team’s finishing order.

The sprint, the descents and the stage graphic. Who is on the front and when each rider swings off; for every bend, the entry, the slowest point, the exit and the braking; and the graphic ready for social media, showing only the riders who have agreed to appear in it.

The season

Load and performance

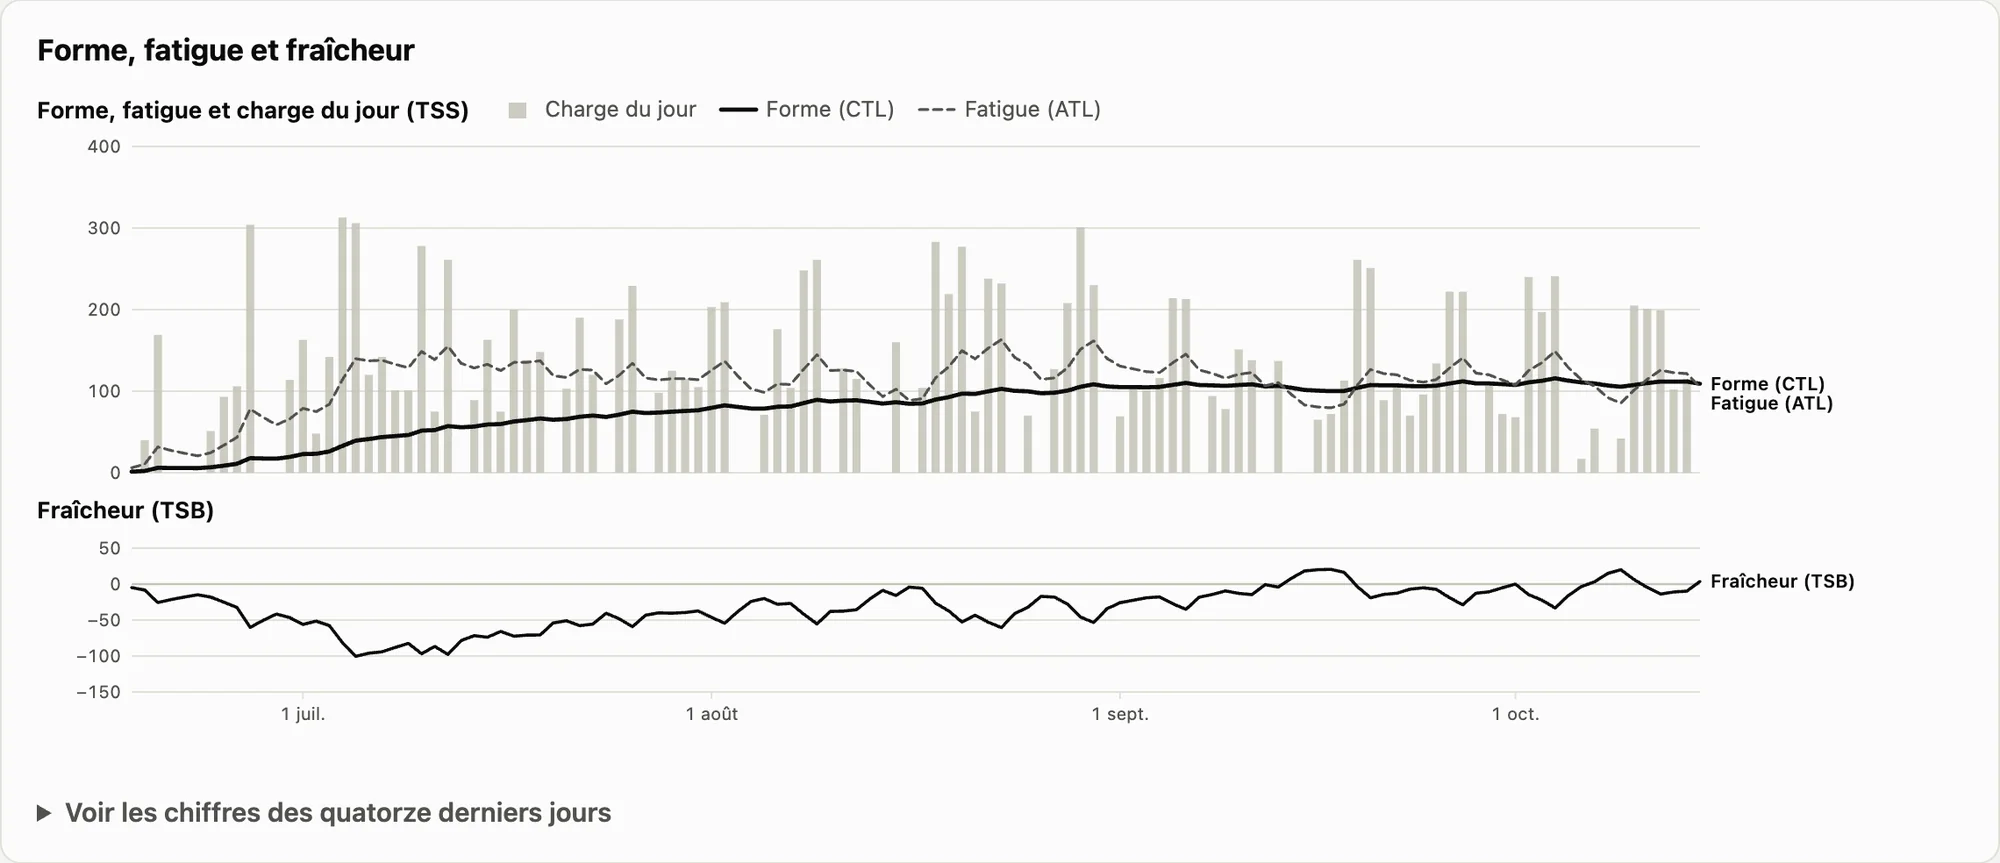
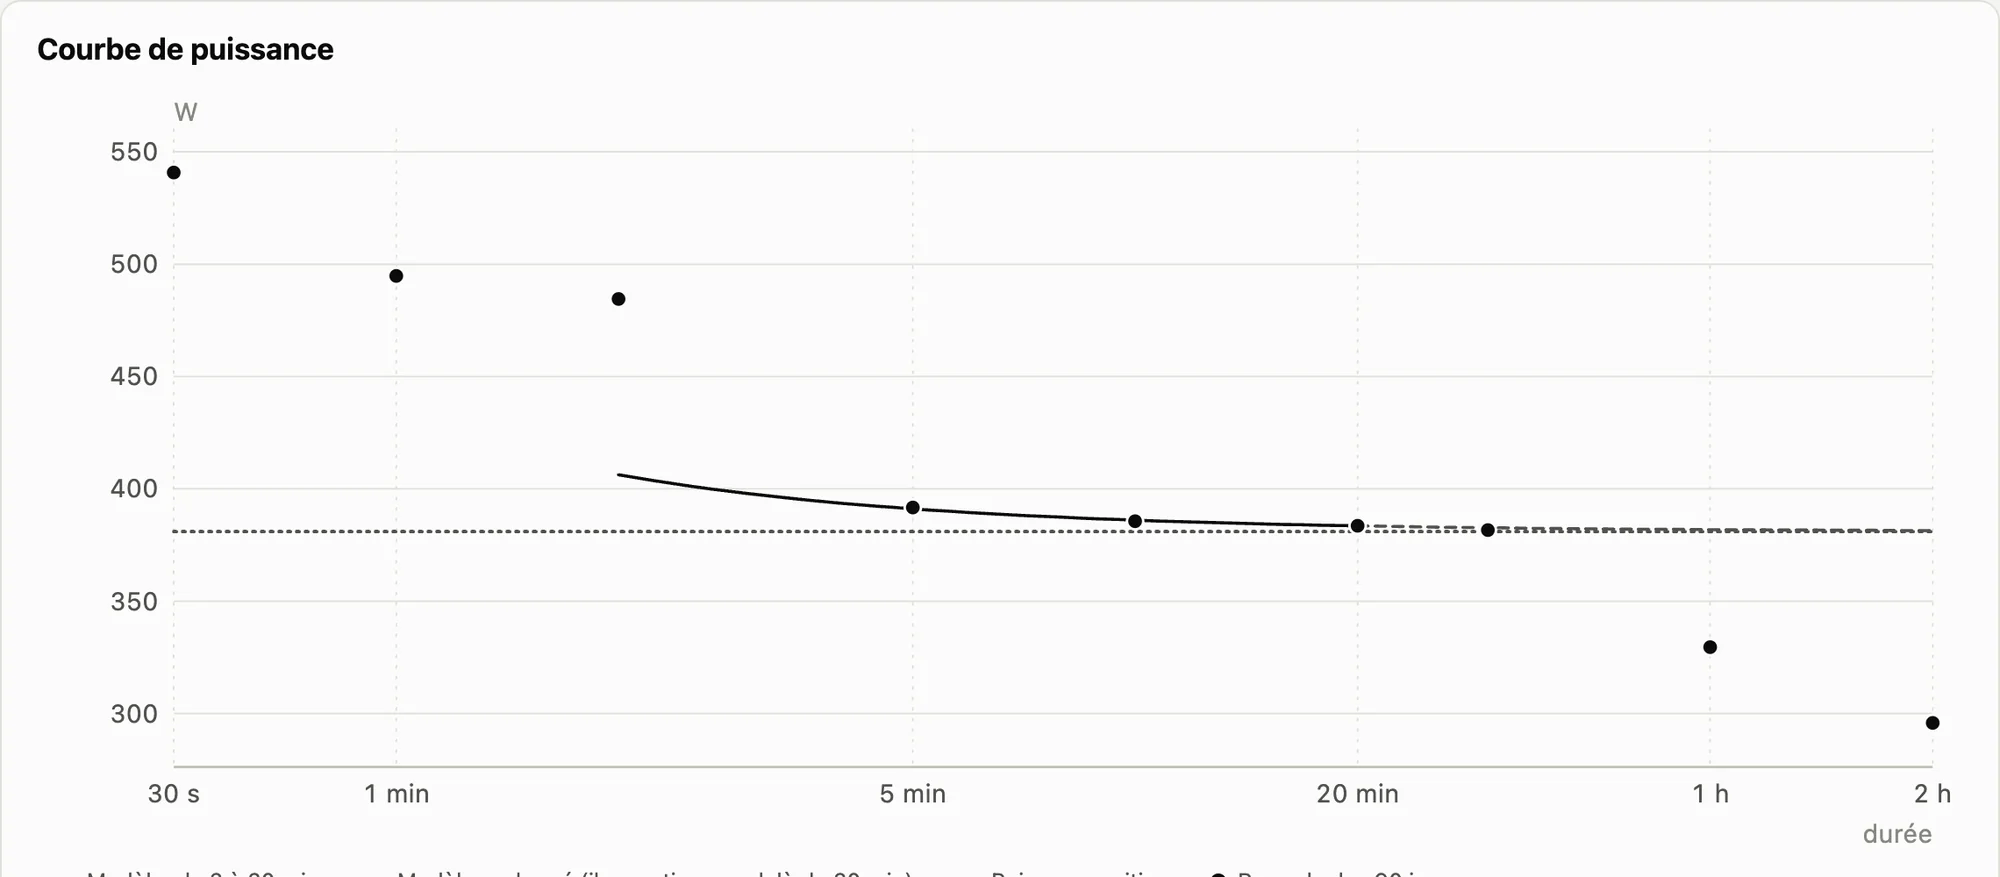
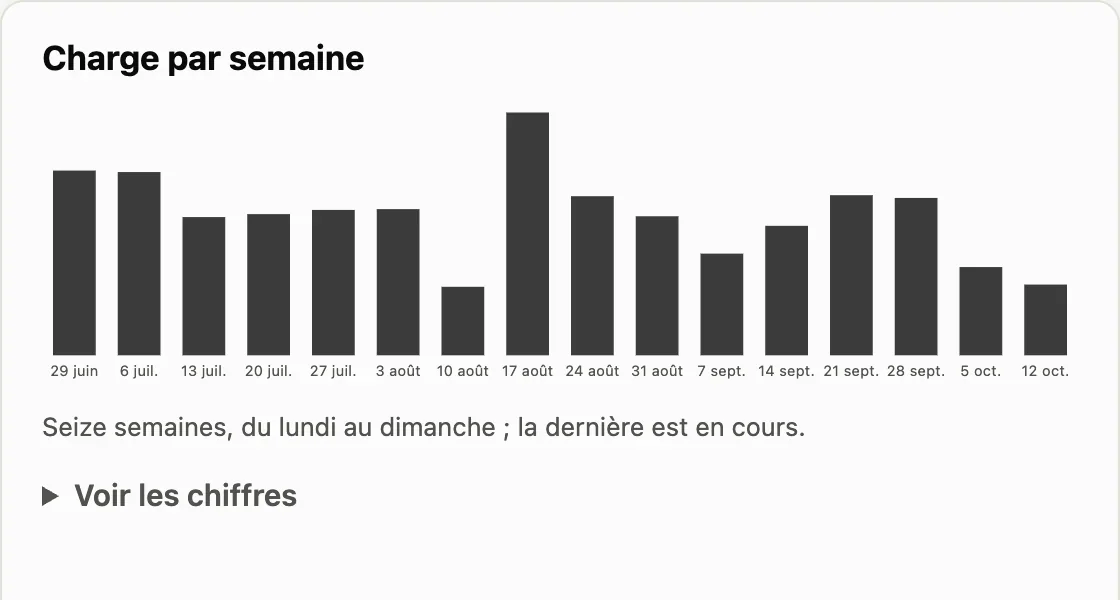
Each rider’s fitness, fatigue and form are tracked day by day, along with recovery and acclimatisation on training camps. Their personal bests shape their digital twin: critical power, the reserve above it, durability. Benchmark climbs rank the team’s efforts year after year. These are estimates, and every page sets out its method.

  • Fatigue resistance
  • Time trial pacing plan
  • Field aero testing
A rider’s fitness, fatigue and form over four months: daily load as bars, fitness and fatigue as lines, form underneath.
The digital twin: the power curve from 30 seconds to 2 hours, personal bests and the model.
Weekly load over sixteen weeks, as bars.

A rider’s profile. Only riders who share their power or heart rate with the staff appear; the others are named, with no data.

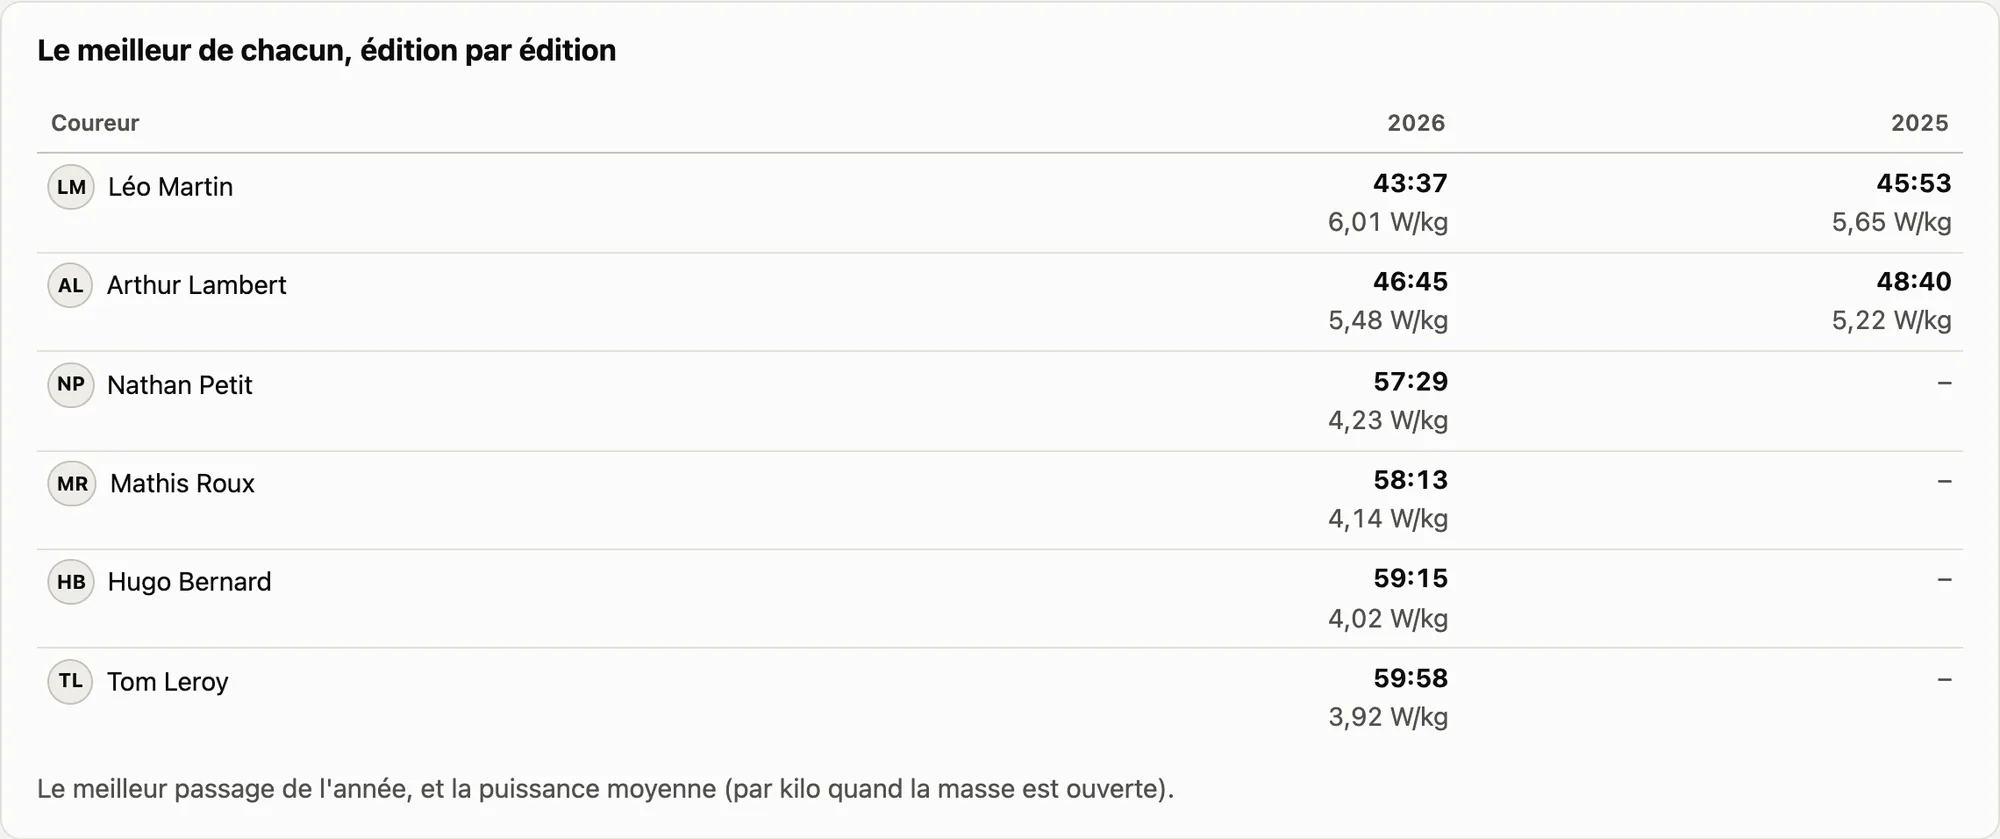
Alpe d’Huez as a benchmark climb: each rider’s best time, edition by edition, and watts per kilo.
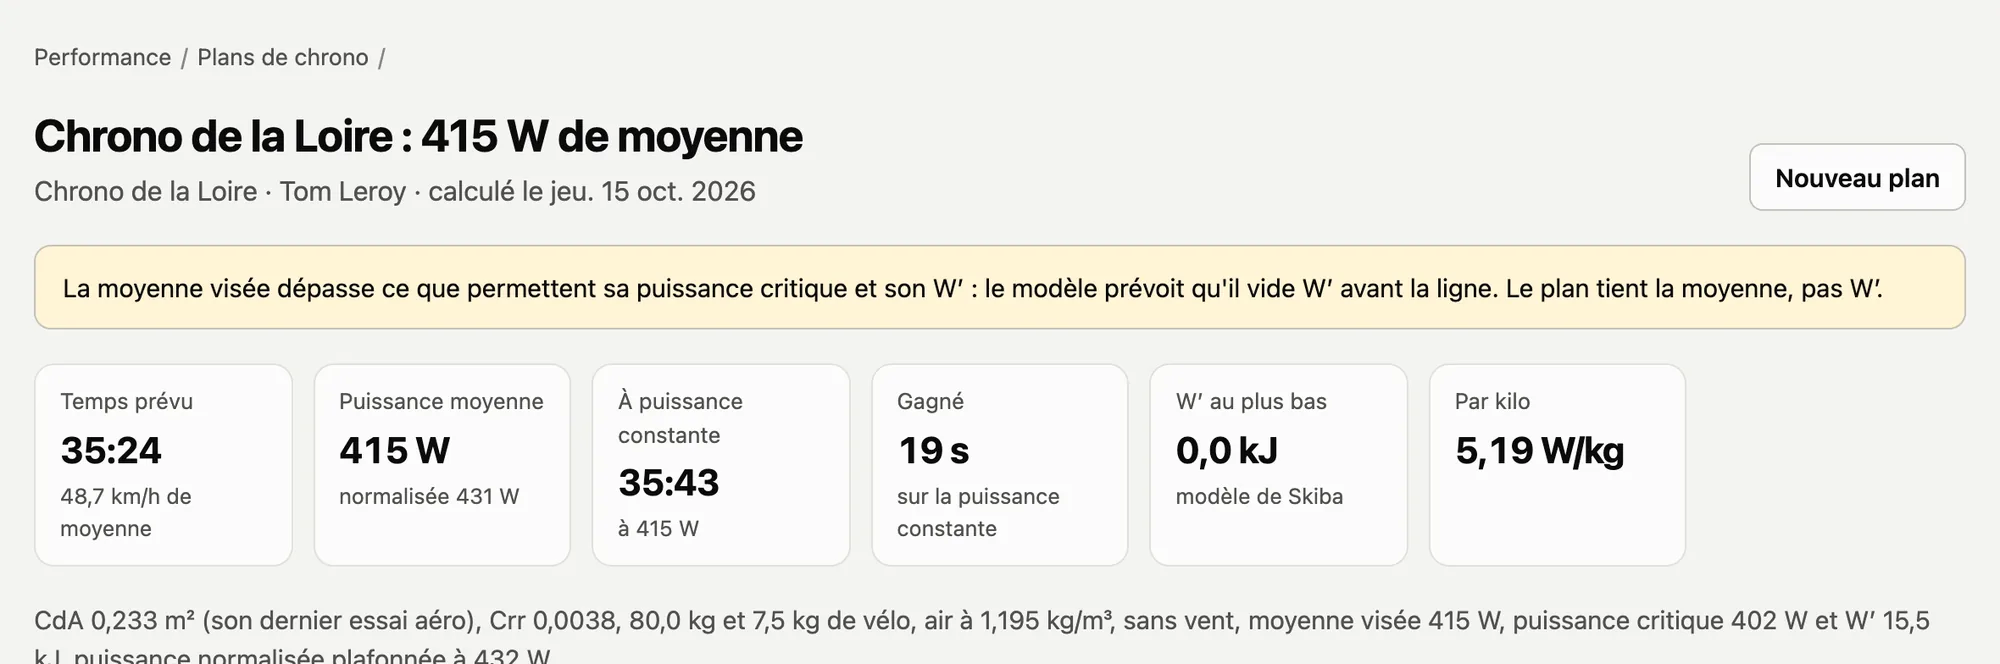
The pacing plan for the Chrono de la Loire: predicted time, average power, time gained over constant power.
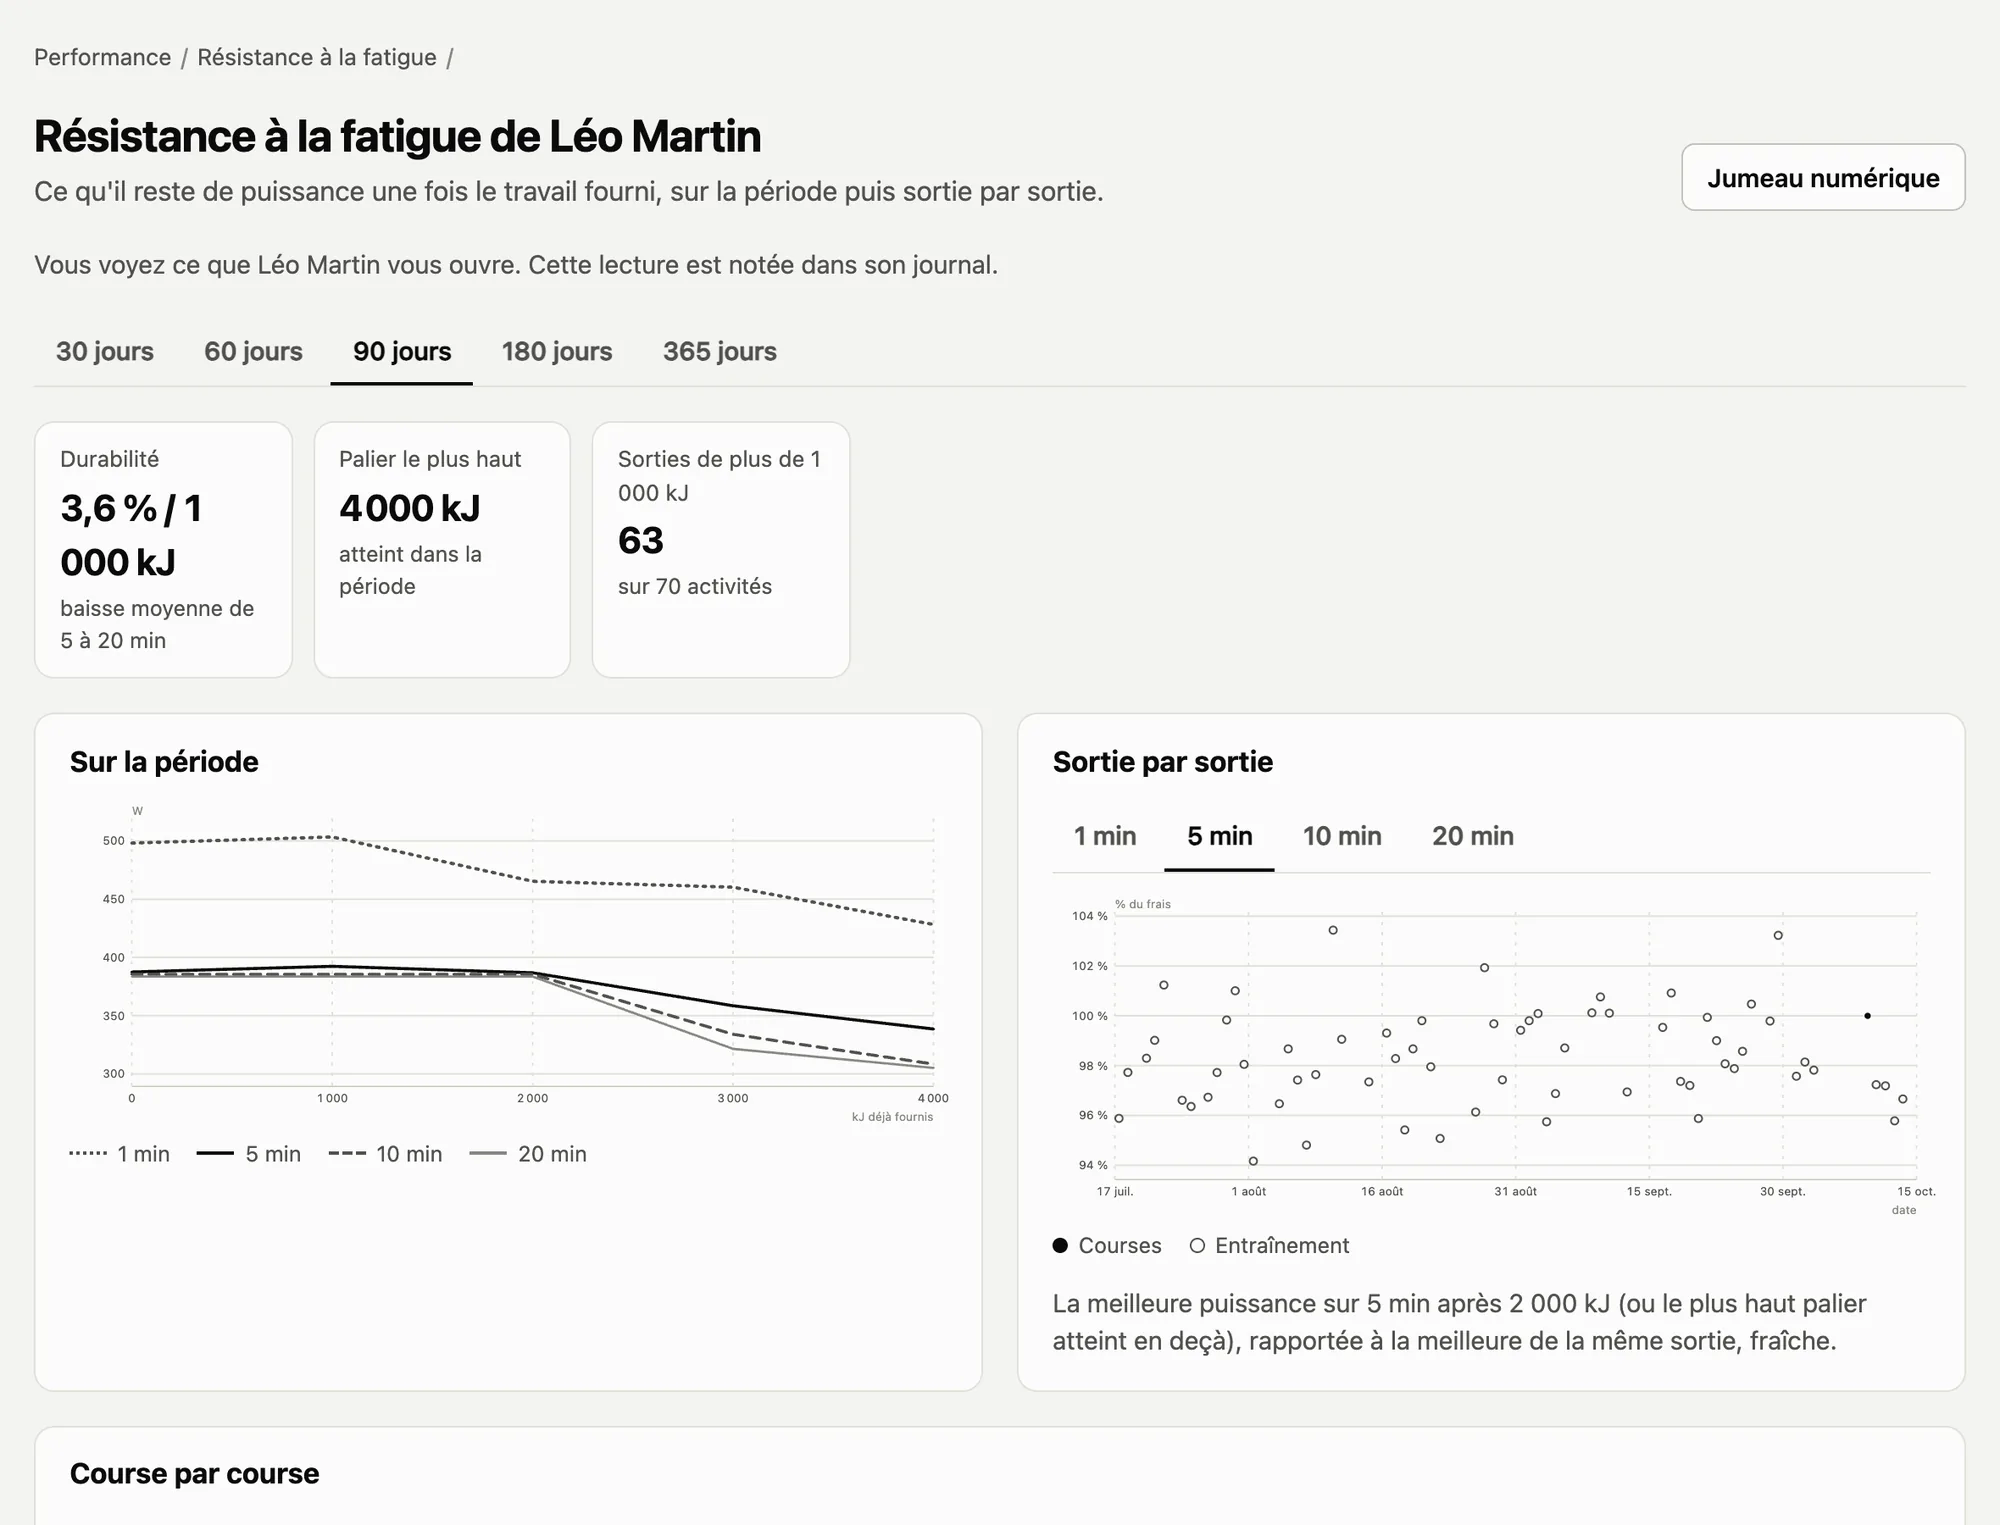
A rider’s fatigue resistance: best power after each level of work already done, over the period and ride by ride.
Saved aero tests: position, helmet, CdA and Crr for each test.

Benchmark climbs, time trial, fatigue and aero. The pacing plan gives the power to hold section by section, without emptying the reserve before the line; CdA is worked out from out-and-back runs on a quiet road.

The staff, each with their own job

Each role unlocks its own sections. Riders’ data, though, is only shared with their consent.

Sports director

Races and selection

The team calendar, the selection and staffing for each race, the live co-pilot, and an assistant that answers from the data it has been given access to.

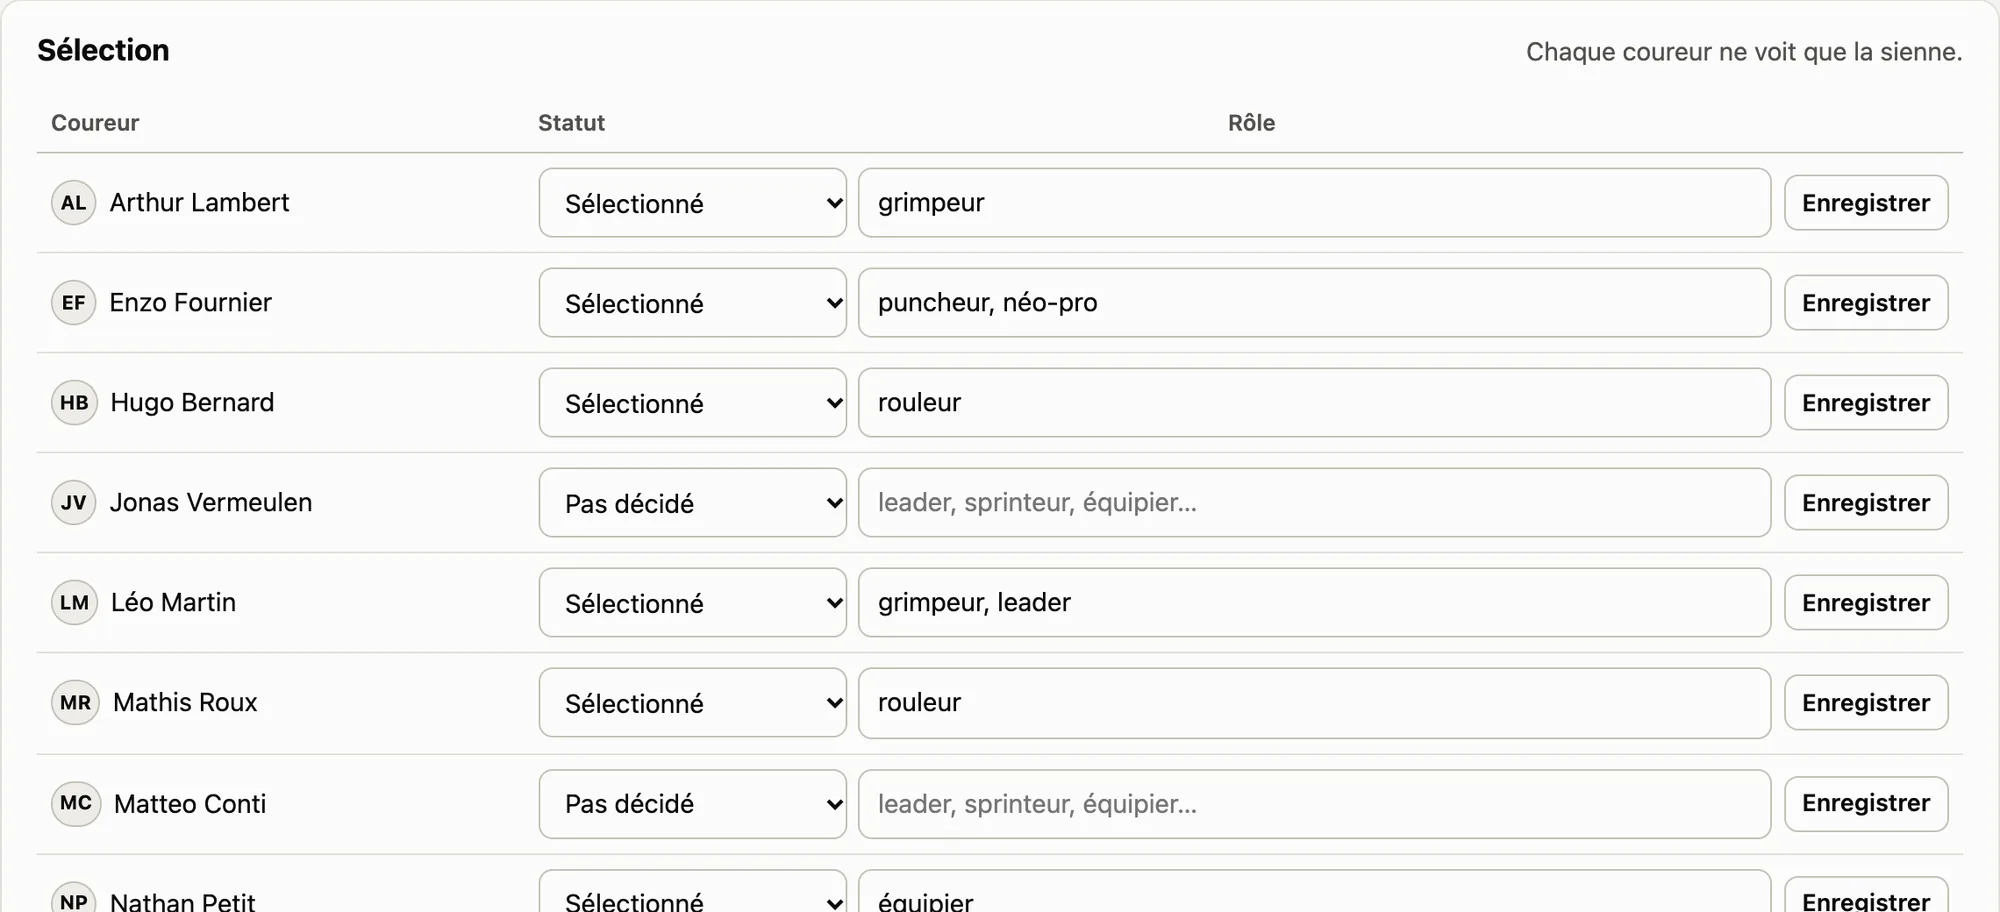
The selection for the Tour de l’Oisans: each rider with their status and role.
  • Calendar, also on your phone
  • Selection and staffing
  • Sports director’s assistant

Coach and sports scientist

Load and performance

Each rider’s load, fatigue resistance and digital twin, the time trial pacing plan and aero tests.

The pacing plan for the Chrono de la Loire.
  • Fitness, fatigue, form
  • Time trial pacing plan
  • CdA from field tests

Team doctor

Recovery

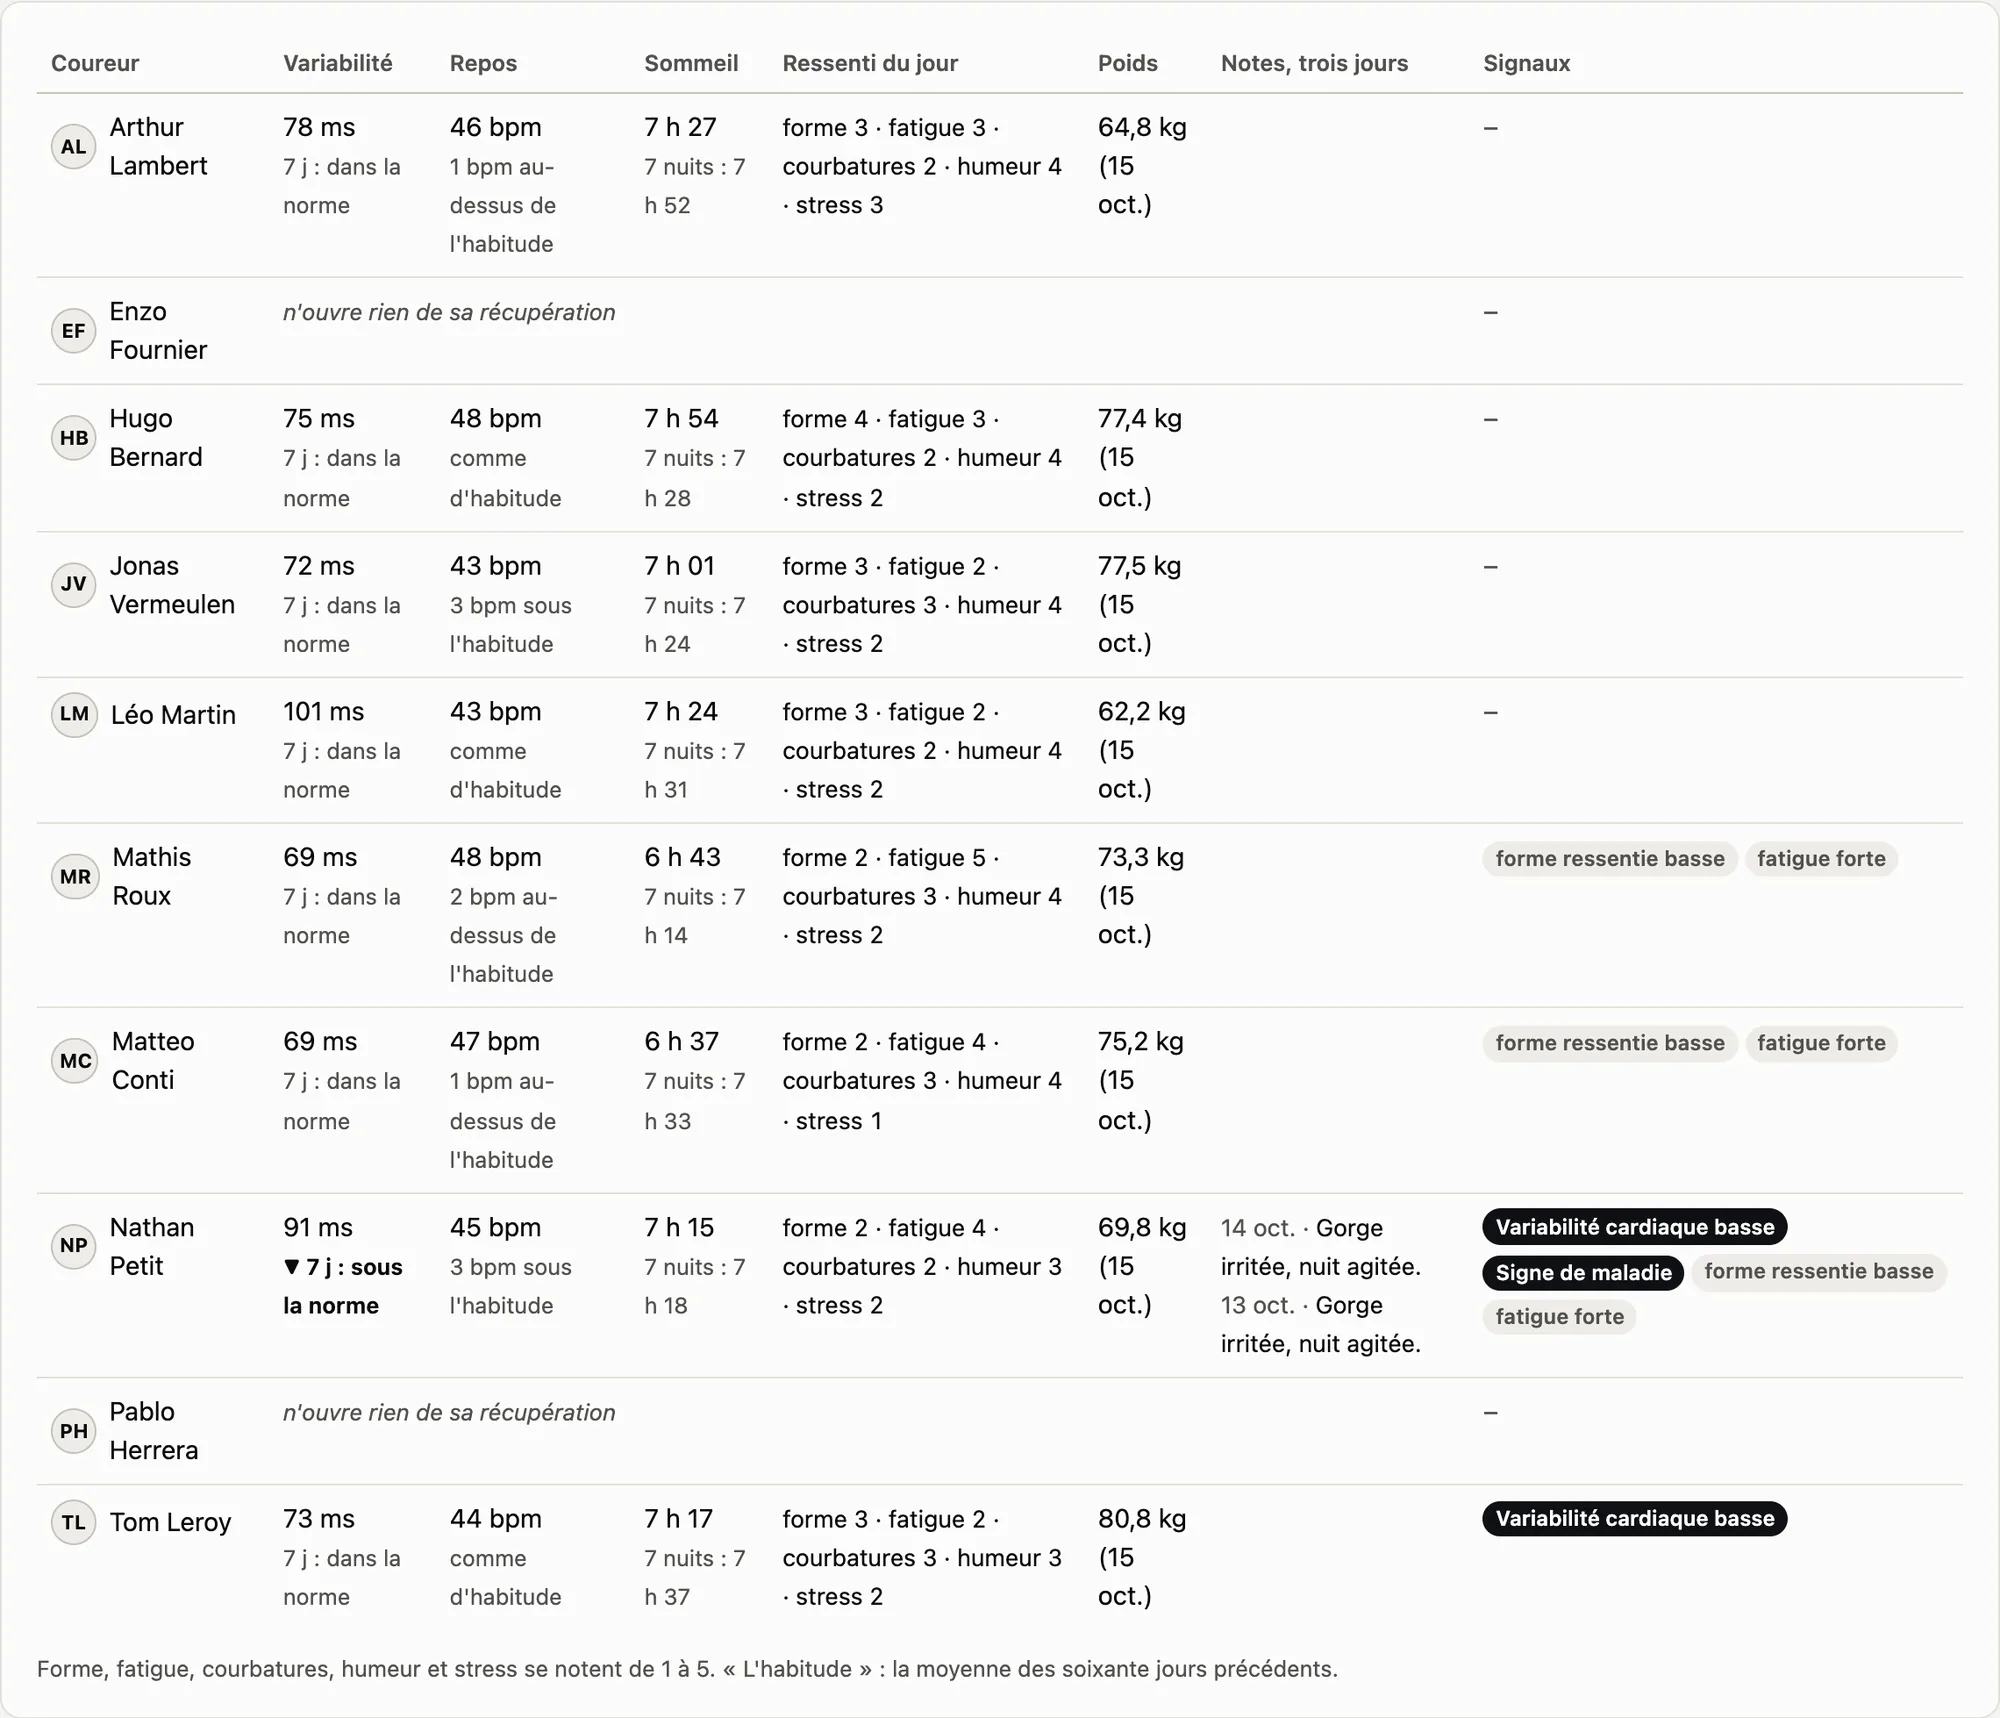
Heart rate variability, resting heart rate, sleep, wellbeing and morning weight, with the signs to watch for: four days below normal, a sore throat noted by the rider.

Team recovery: heart rate variability, resting heart rate, sleep, wellbeing, weight and warning signs, rider by rider.
  • Team recovery
  • Weight is shared only with the doctor
  • Acclimatisation on training camps

Mechanic

The equipment log

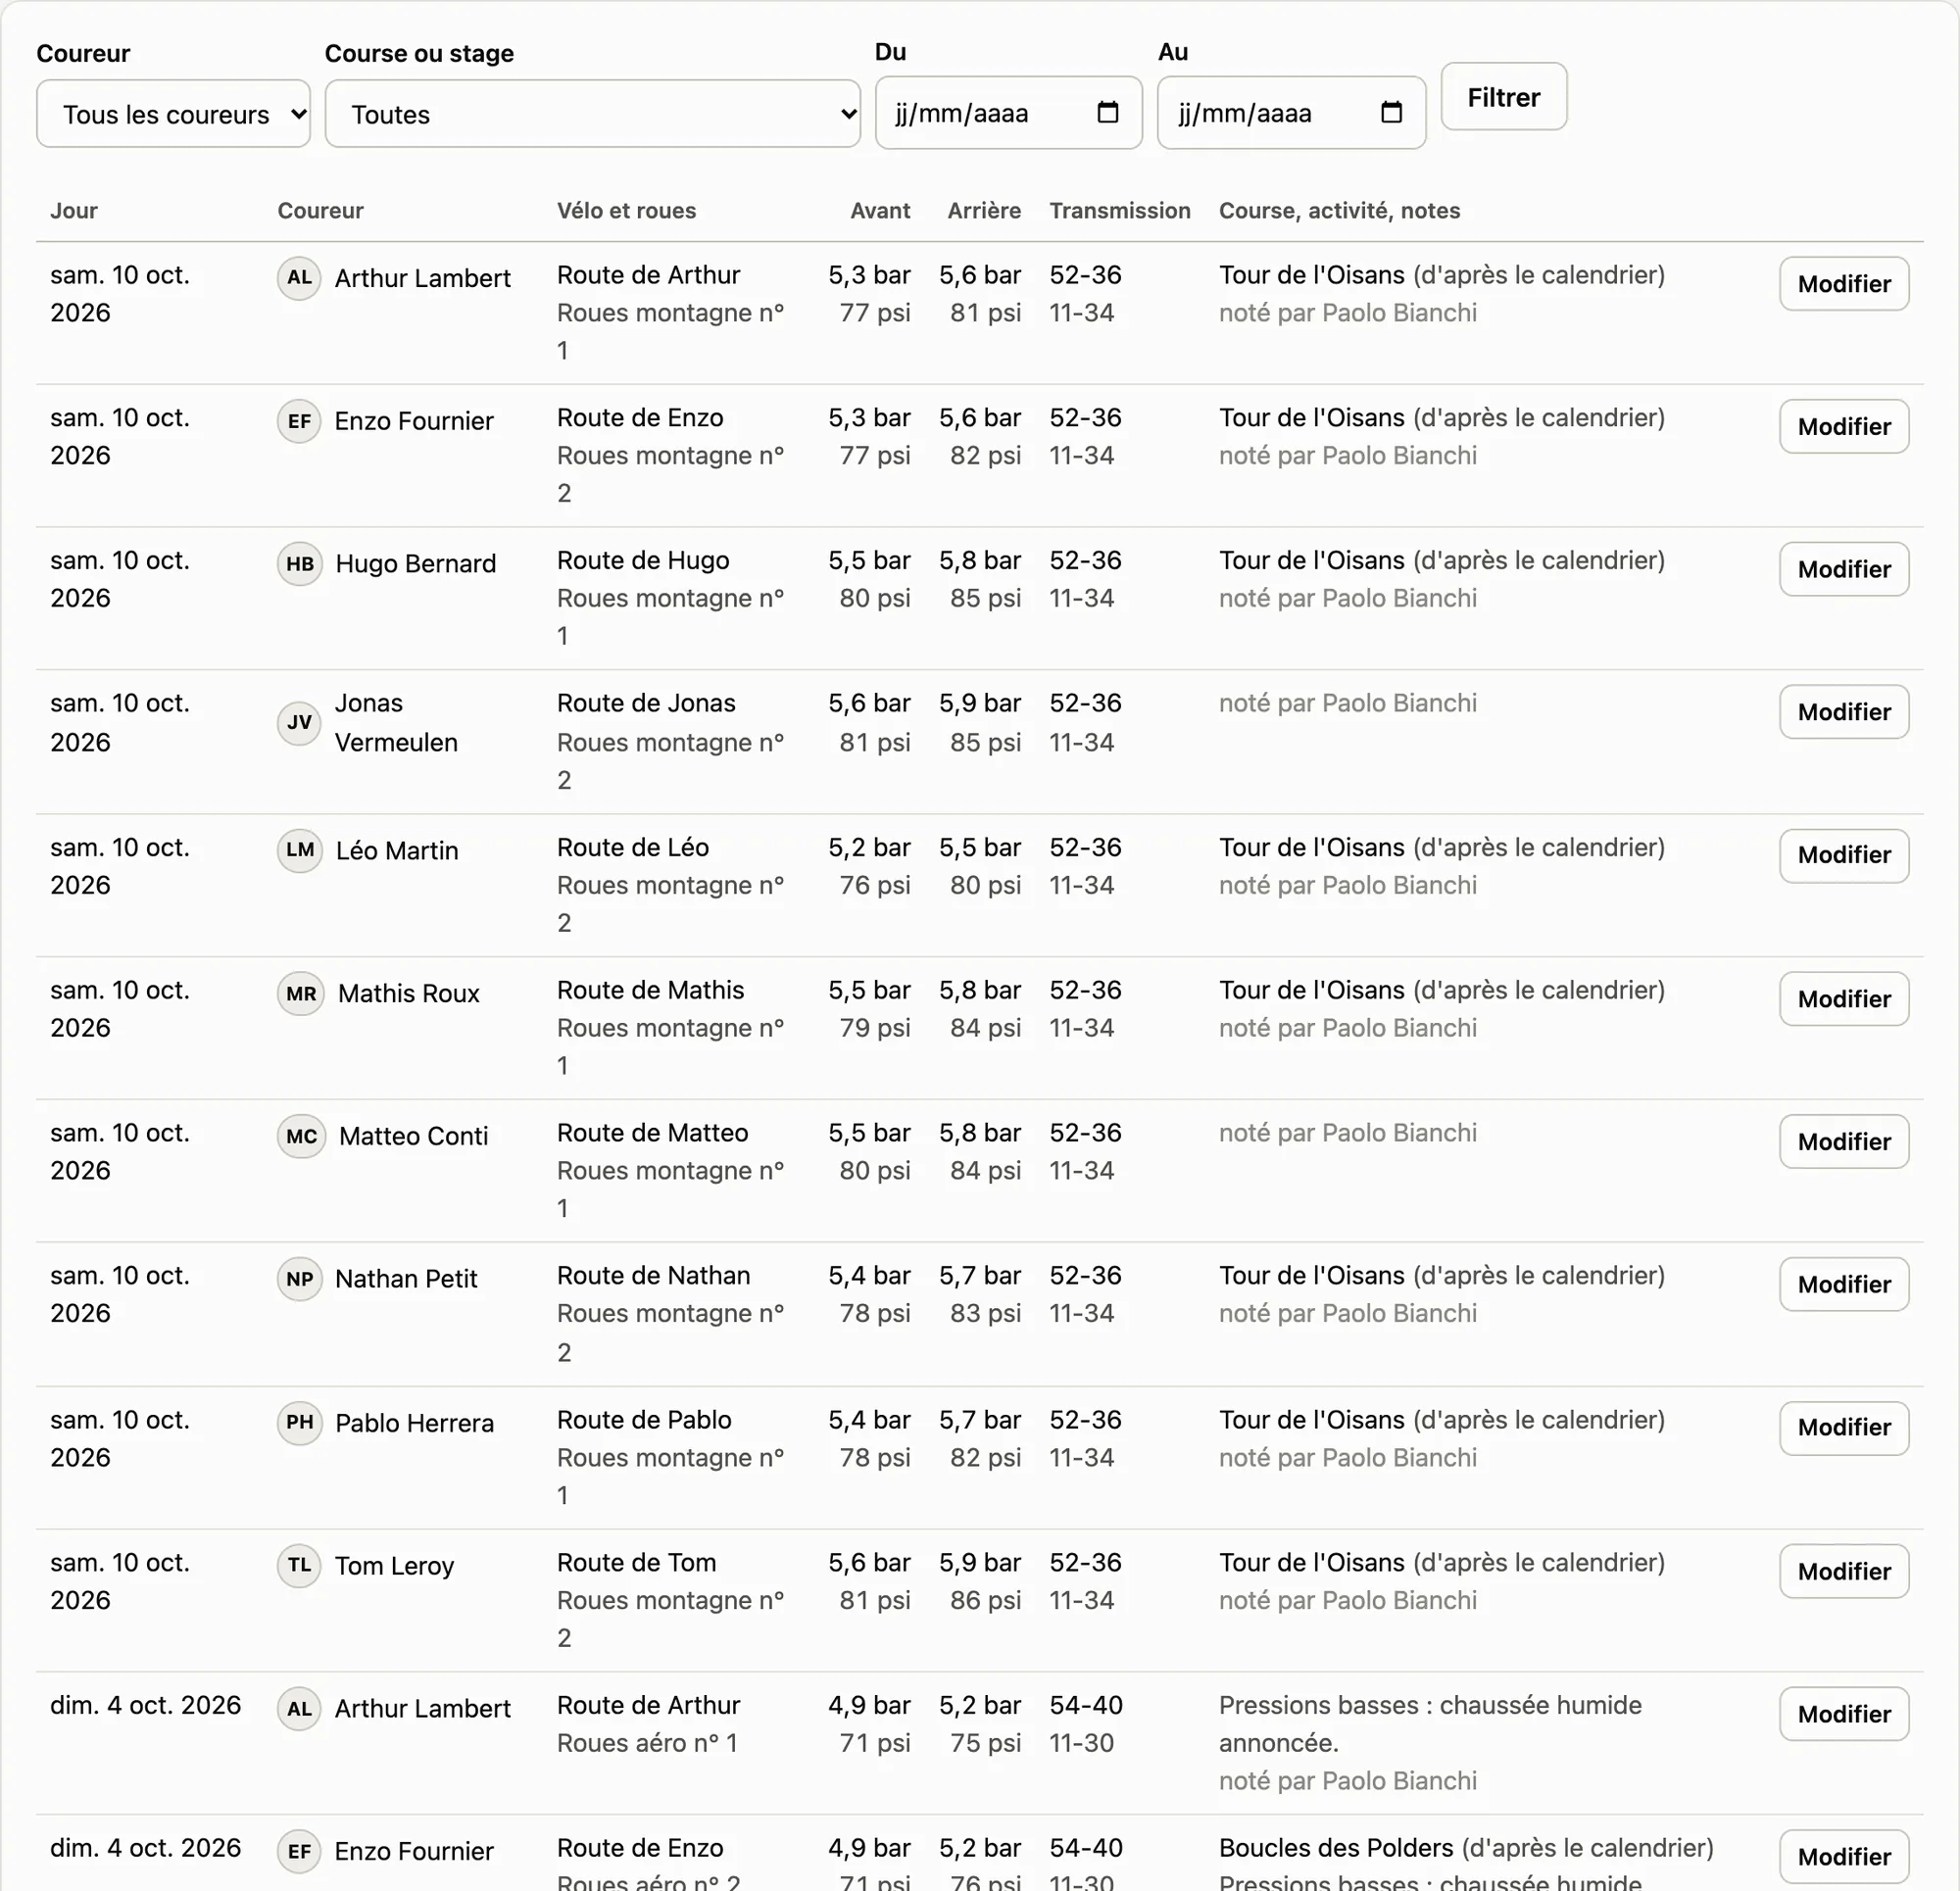
Bikes, wheels and tyre pressures, day by day, and how they performed in races; the gearing to fit for the steepest section.

The mechanic’s log: for each rider and each day, the bike, the wheels, front and rear tyre pressures and the drivetrain.
  • Bikes, wheels, tyre pressures
  • Gearing and wheels for each stage
  • How the equipment performed in races

Nutritionist

Fuelling

The hour-by-hour plan based on the expected duration, intensity and heat: carbohydrate, bottles, bars and gels, and what to carry from the start.

The hour-by-hour fuelling plan.
  • Carbohydrate burned and to take in
  • Bottles, bars and gels
  • Feed zones from the road book

Analyst

Races, replayed

Races replayed and explained, the simulator, and the benchmark climbs where the team measures itself from one year to the next.

Alpe d’Huez as a benchmark climb: each rider’s best, edition by edition.
  • Who did the work, descents, sprint
  • Race simulator
  • Benchmark climbs

Scout

Prospects

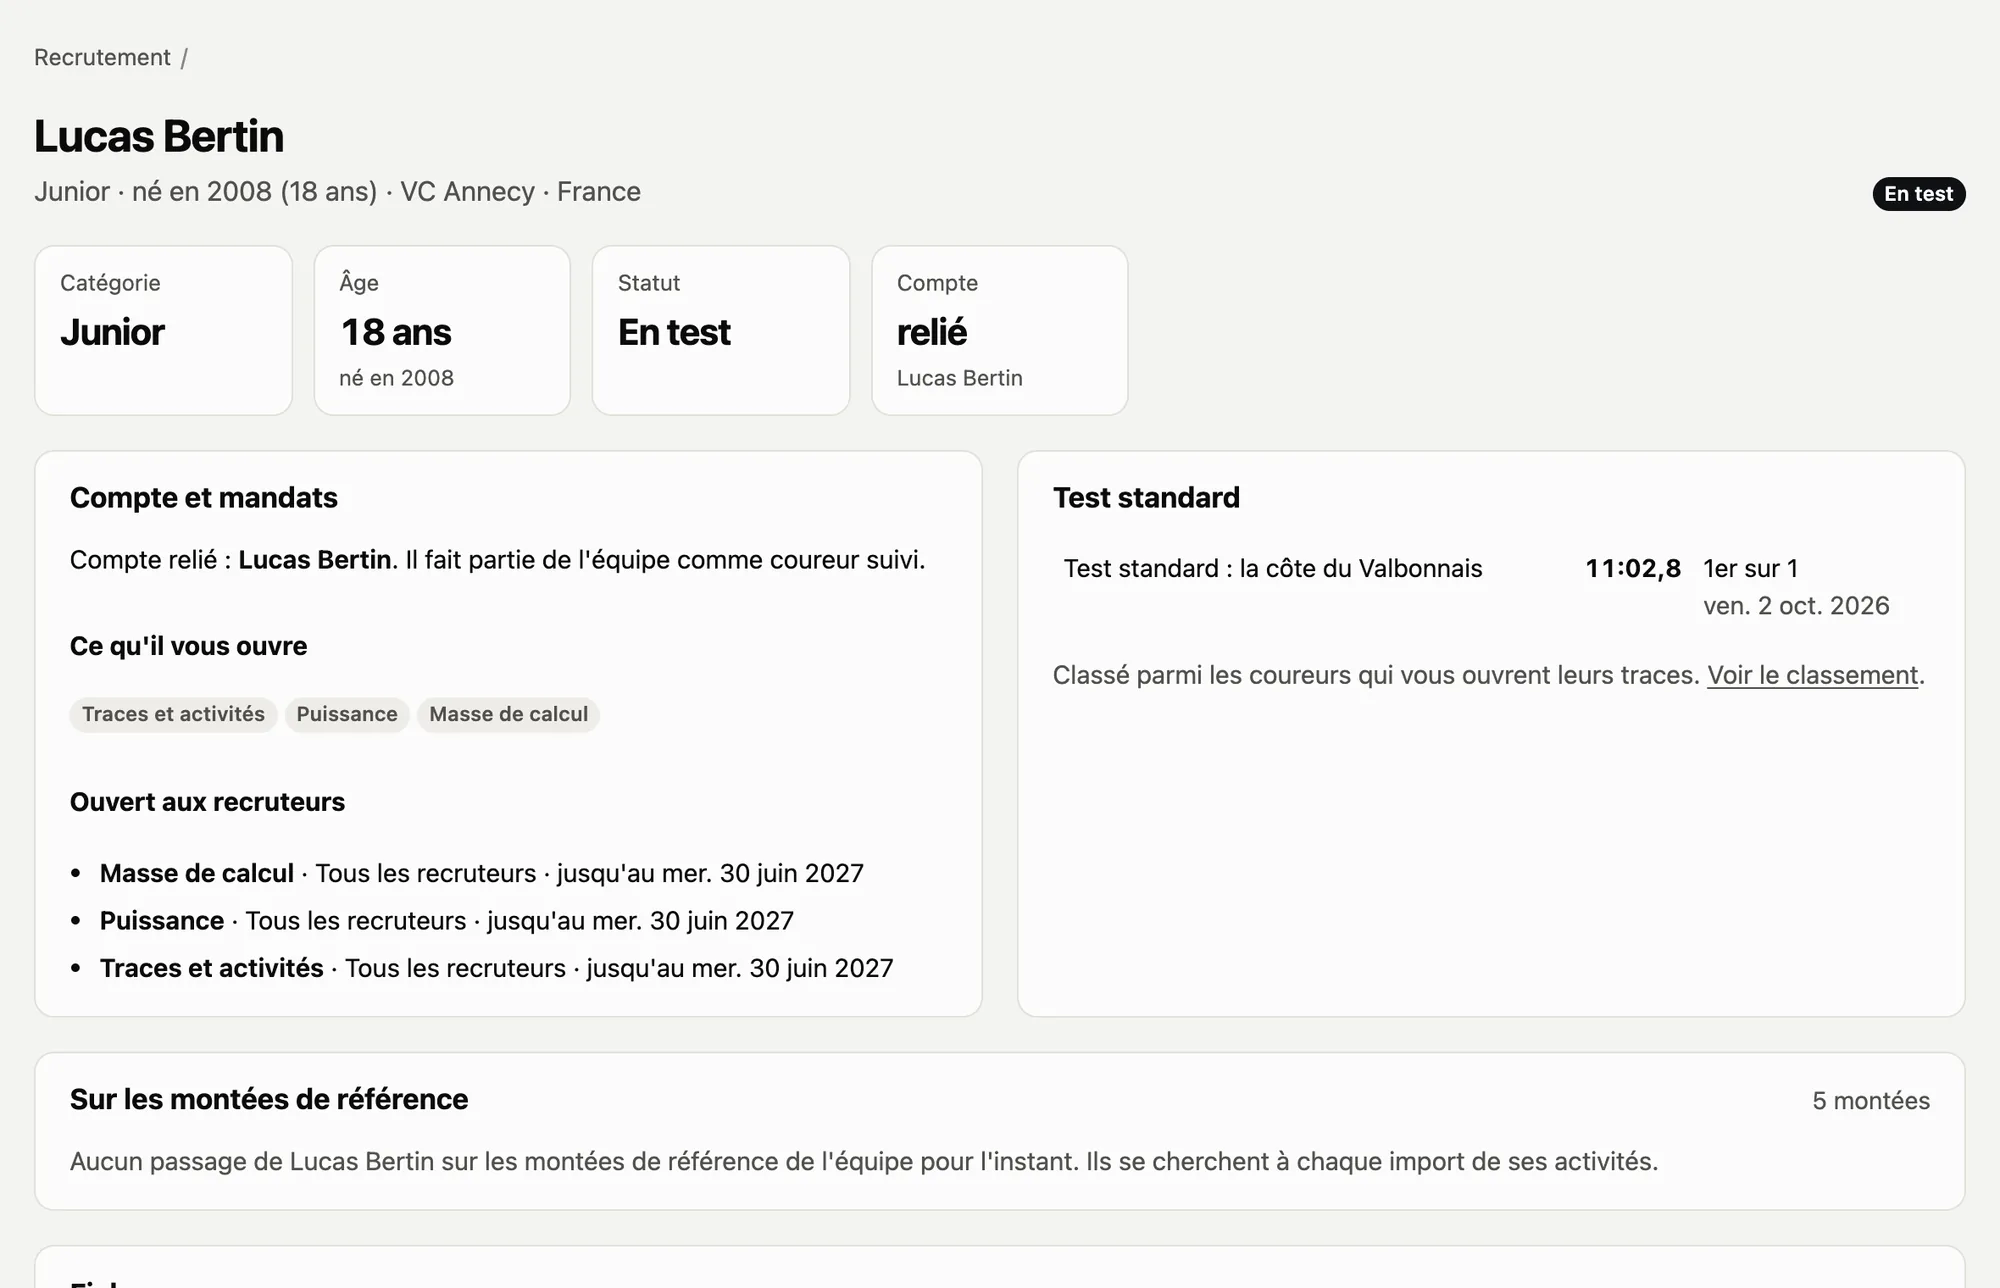
The young riders the team is following, their profiles, and a standard test ridden on a smart trainer, ranked separately from road times. A prospect sees only their own area.

A junior prospect’s profile: category, age, status, what they share with scouts and their standard test.
  • Prospect profiles
  • Standard smart trainer test
  • What they share with scouts

Partners and communications

Ride with the pros

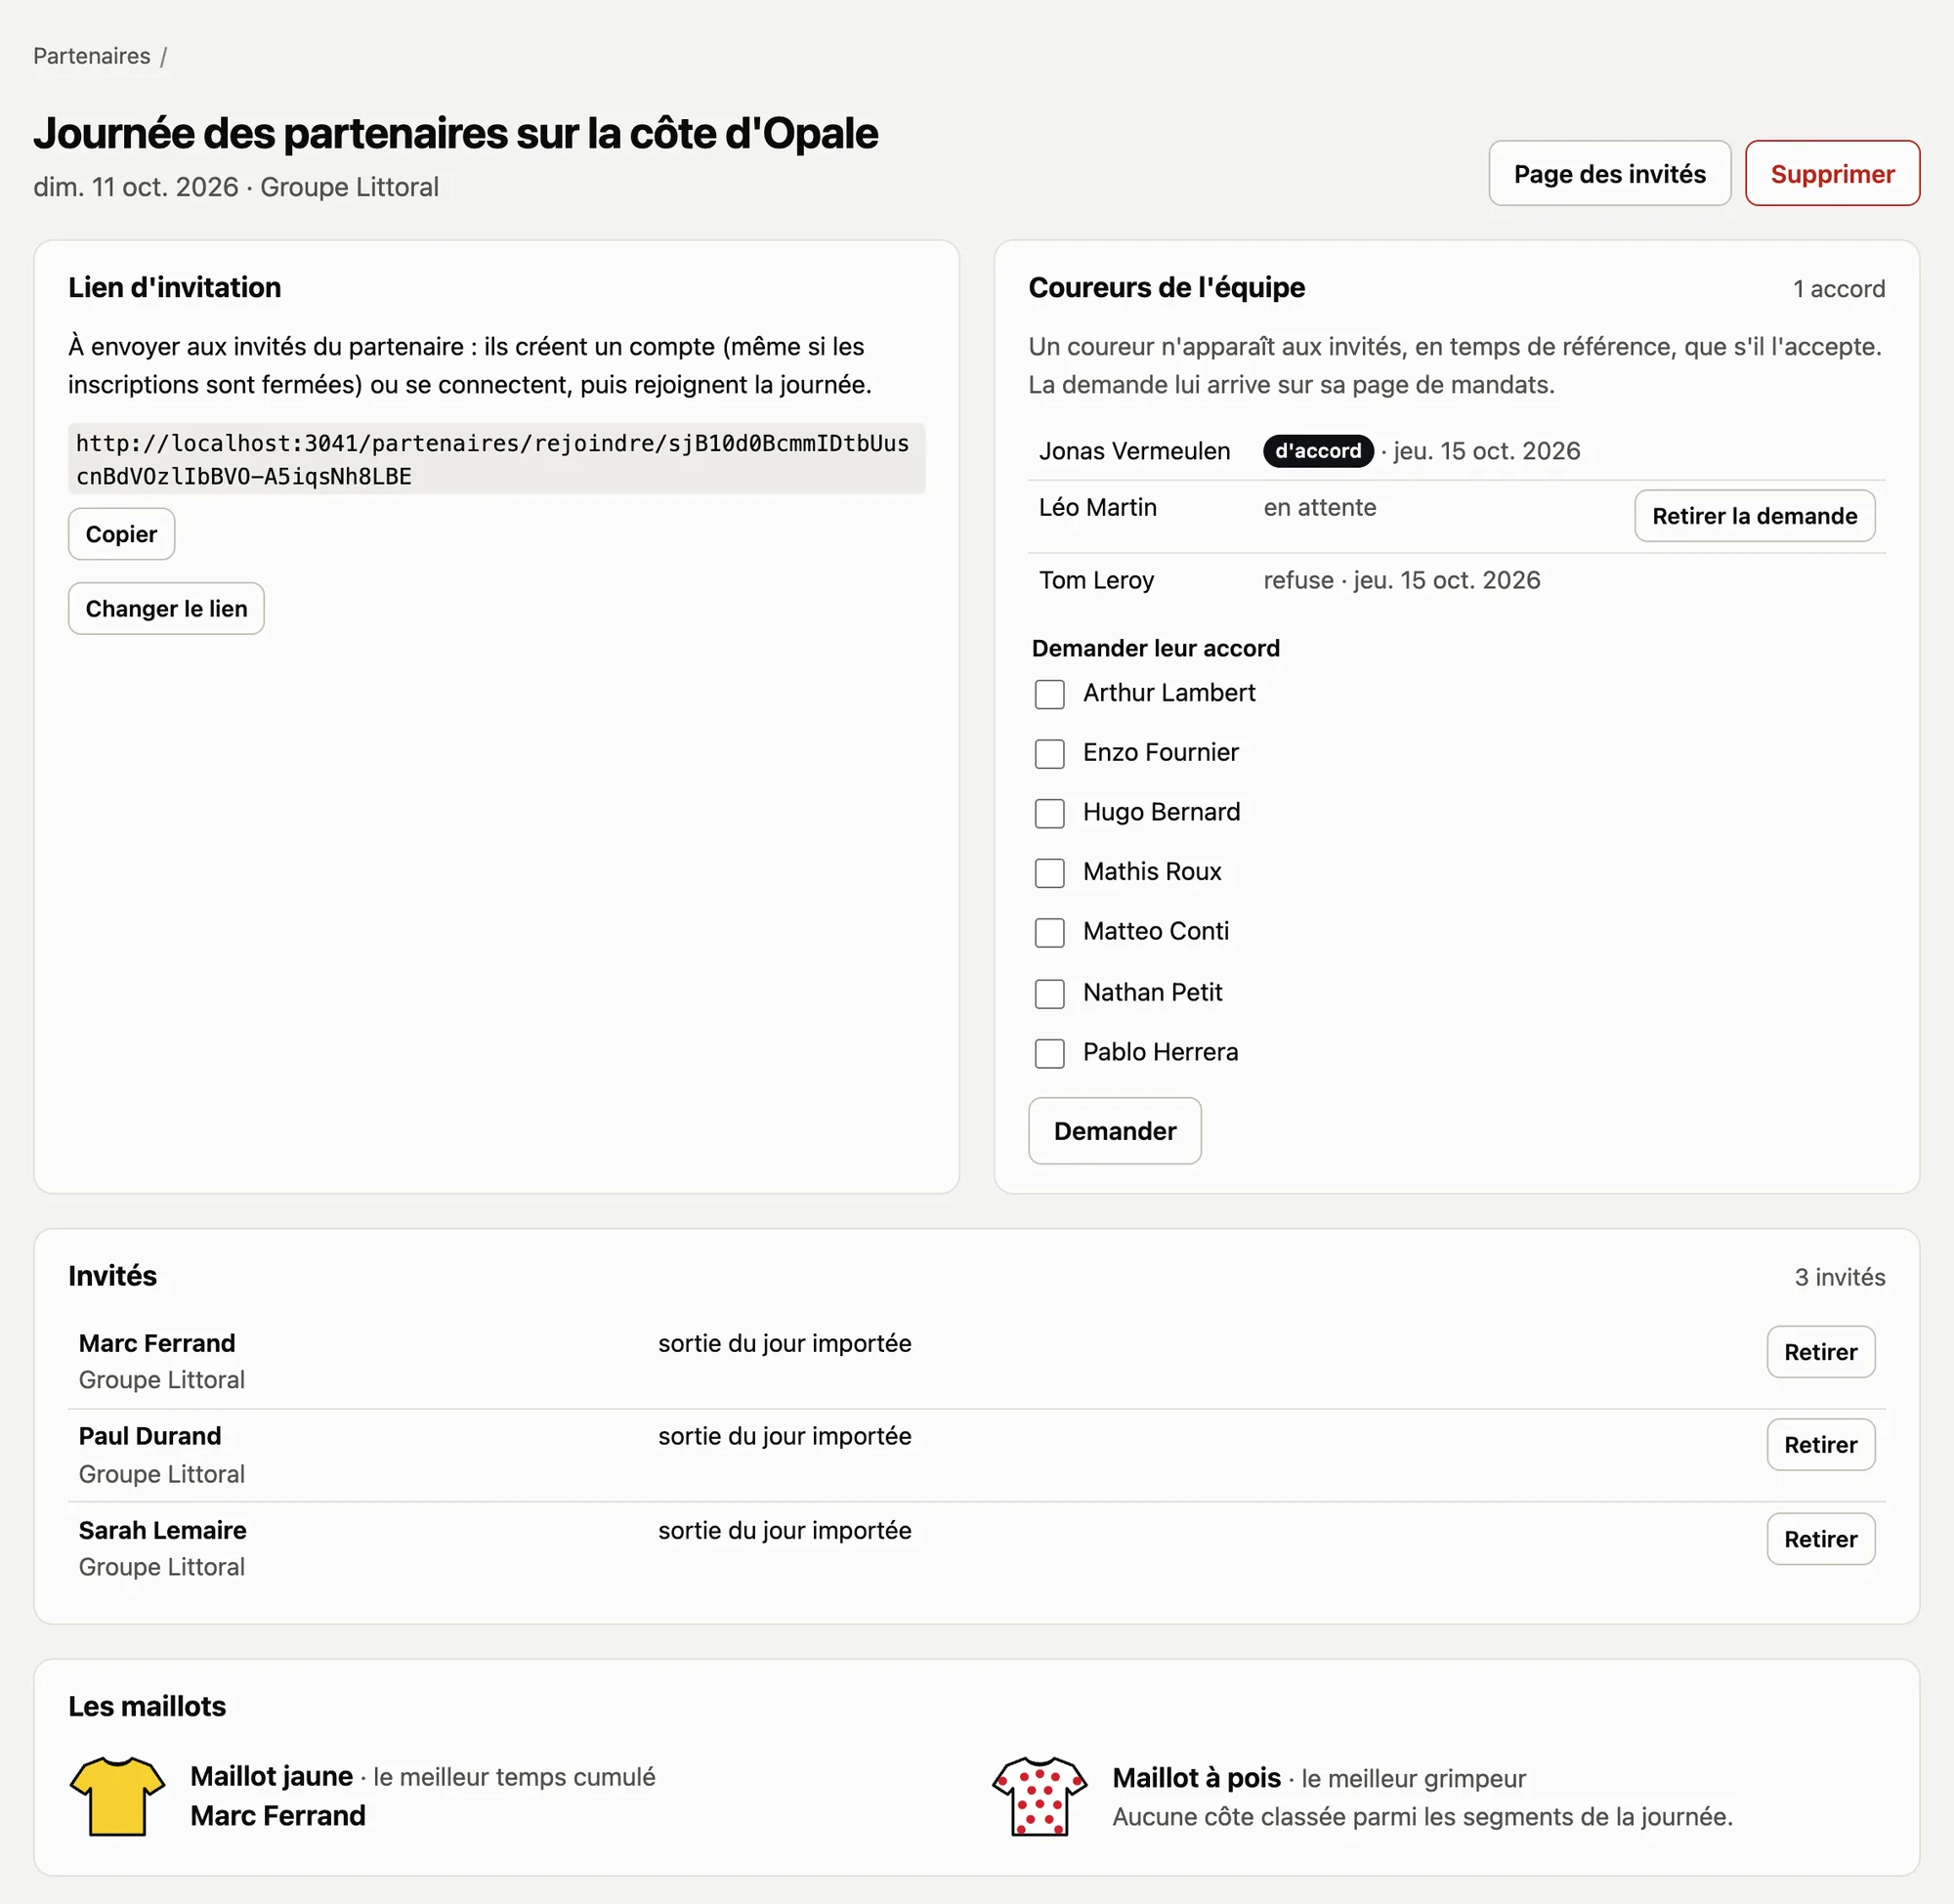
A day with a partner’s guests on the team’s climbs, with its own leaderboard and jerseys; the public race and the stage graphic, with the riders’ consent.

A partner day: the invitation link, the riders’ consent, the guests and the jerseys.
  • Partner days
  • Public race, positions only
  • Stage graphic

Team manager

The team

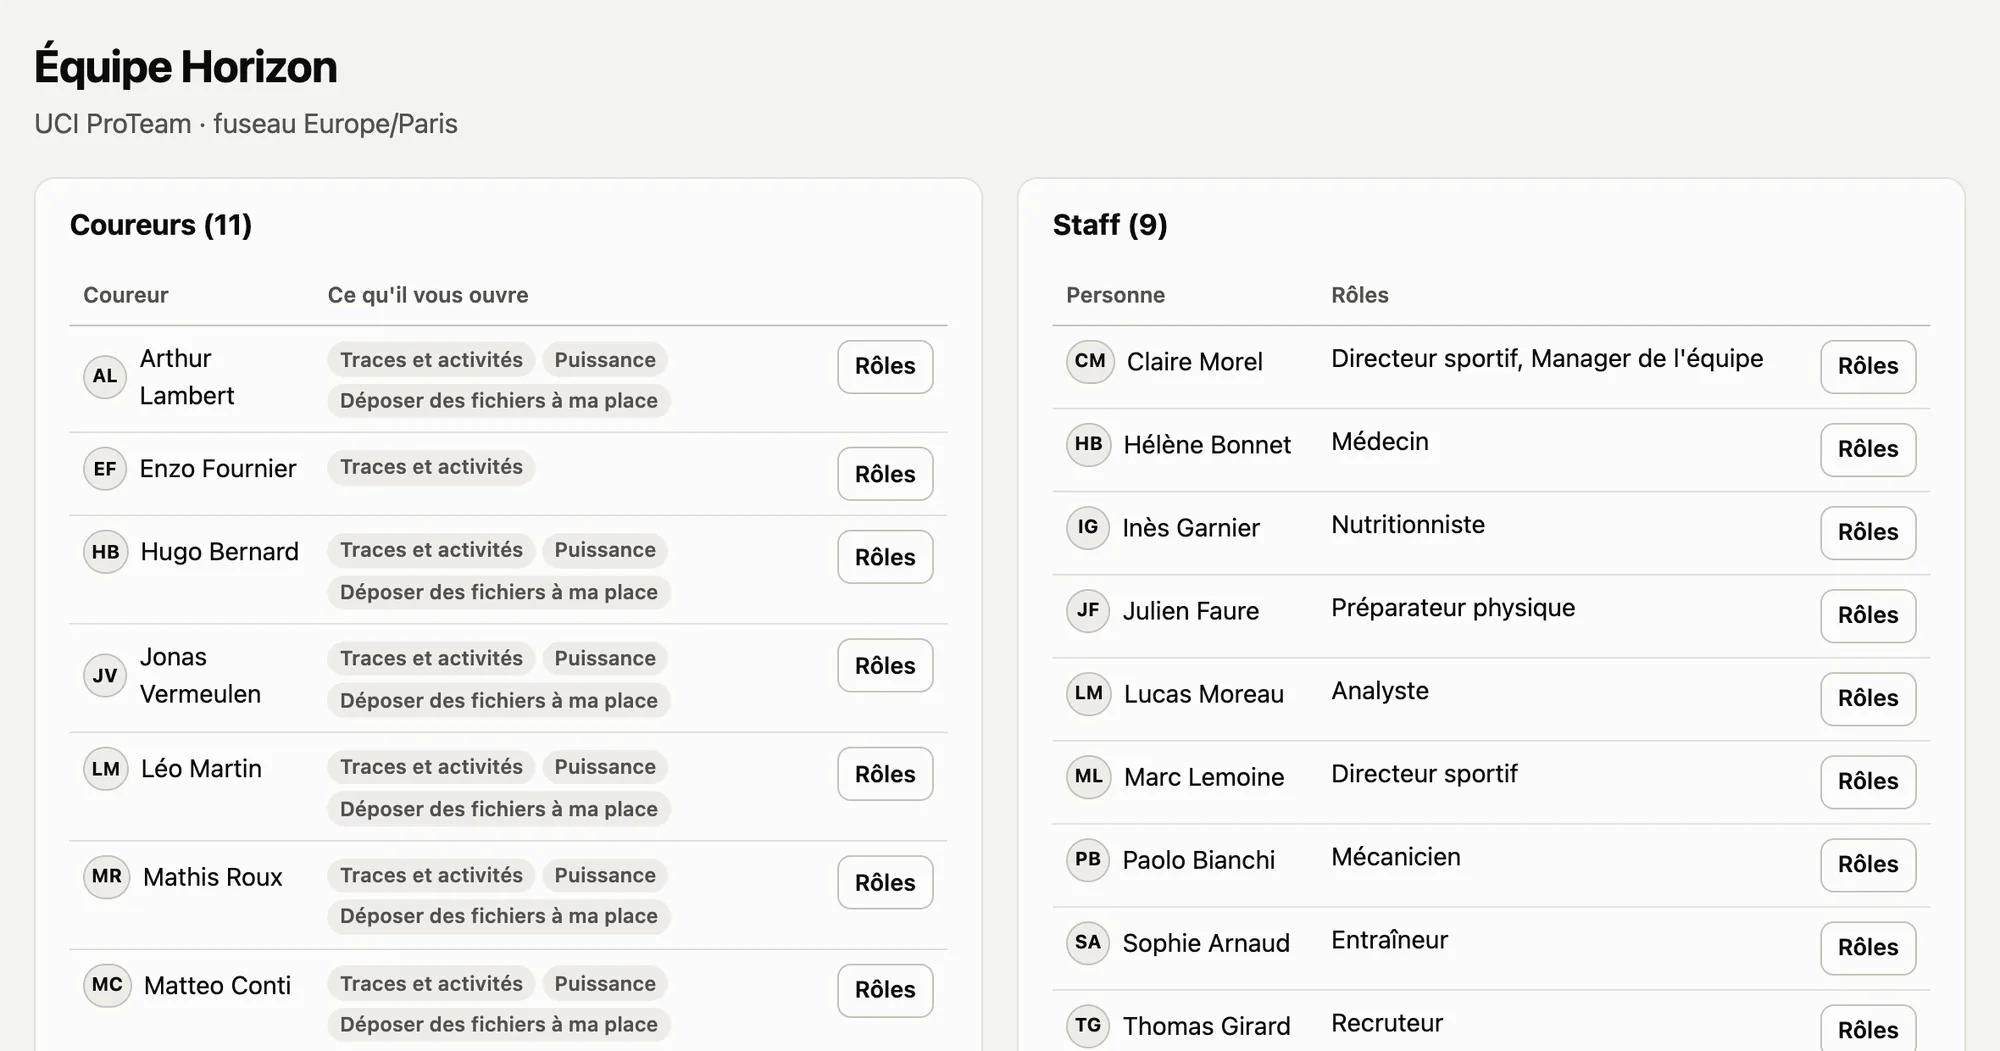
The riders and what each one shares, the staff and their roles, invitations by link, team settings.

The team page: the riders and what they share, the staff and their roles.
  • Staff roles
  • Invitations by link
  • One person, several roles

The rider decides

Riders own their data.

Nothing is shared with the staff without the rider’s consent. The rider shares each type of data with a role or a person, until a set date, and can withdraw it at any time. Whatever is not shared is shown nowhere and never leaves the server.

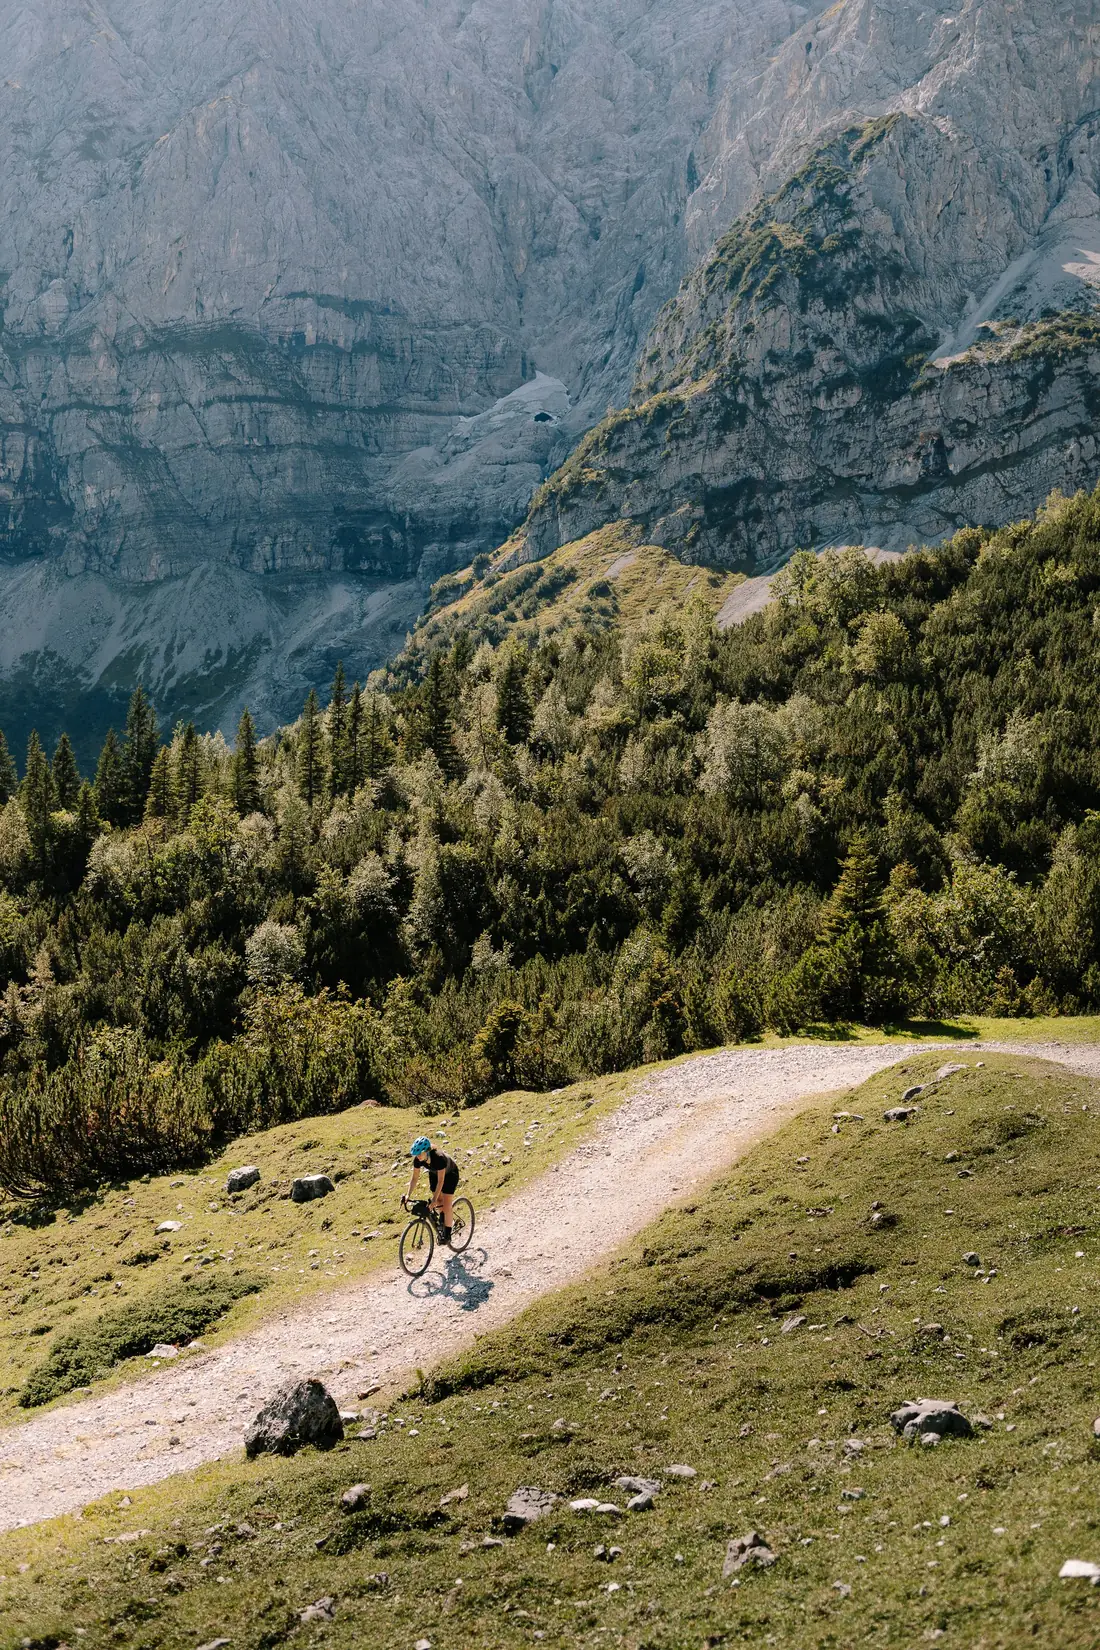
A lone rider on a mountain road, beneath the cliffs.
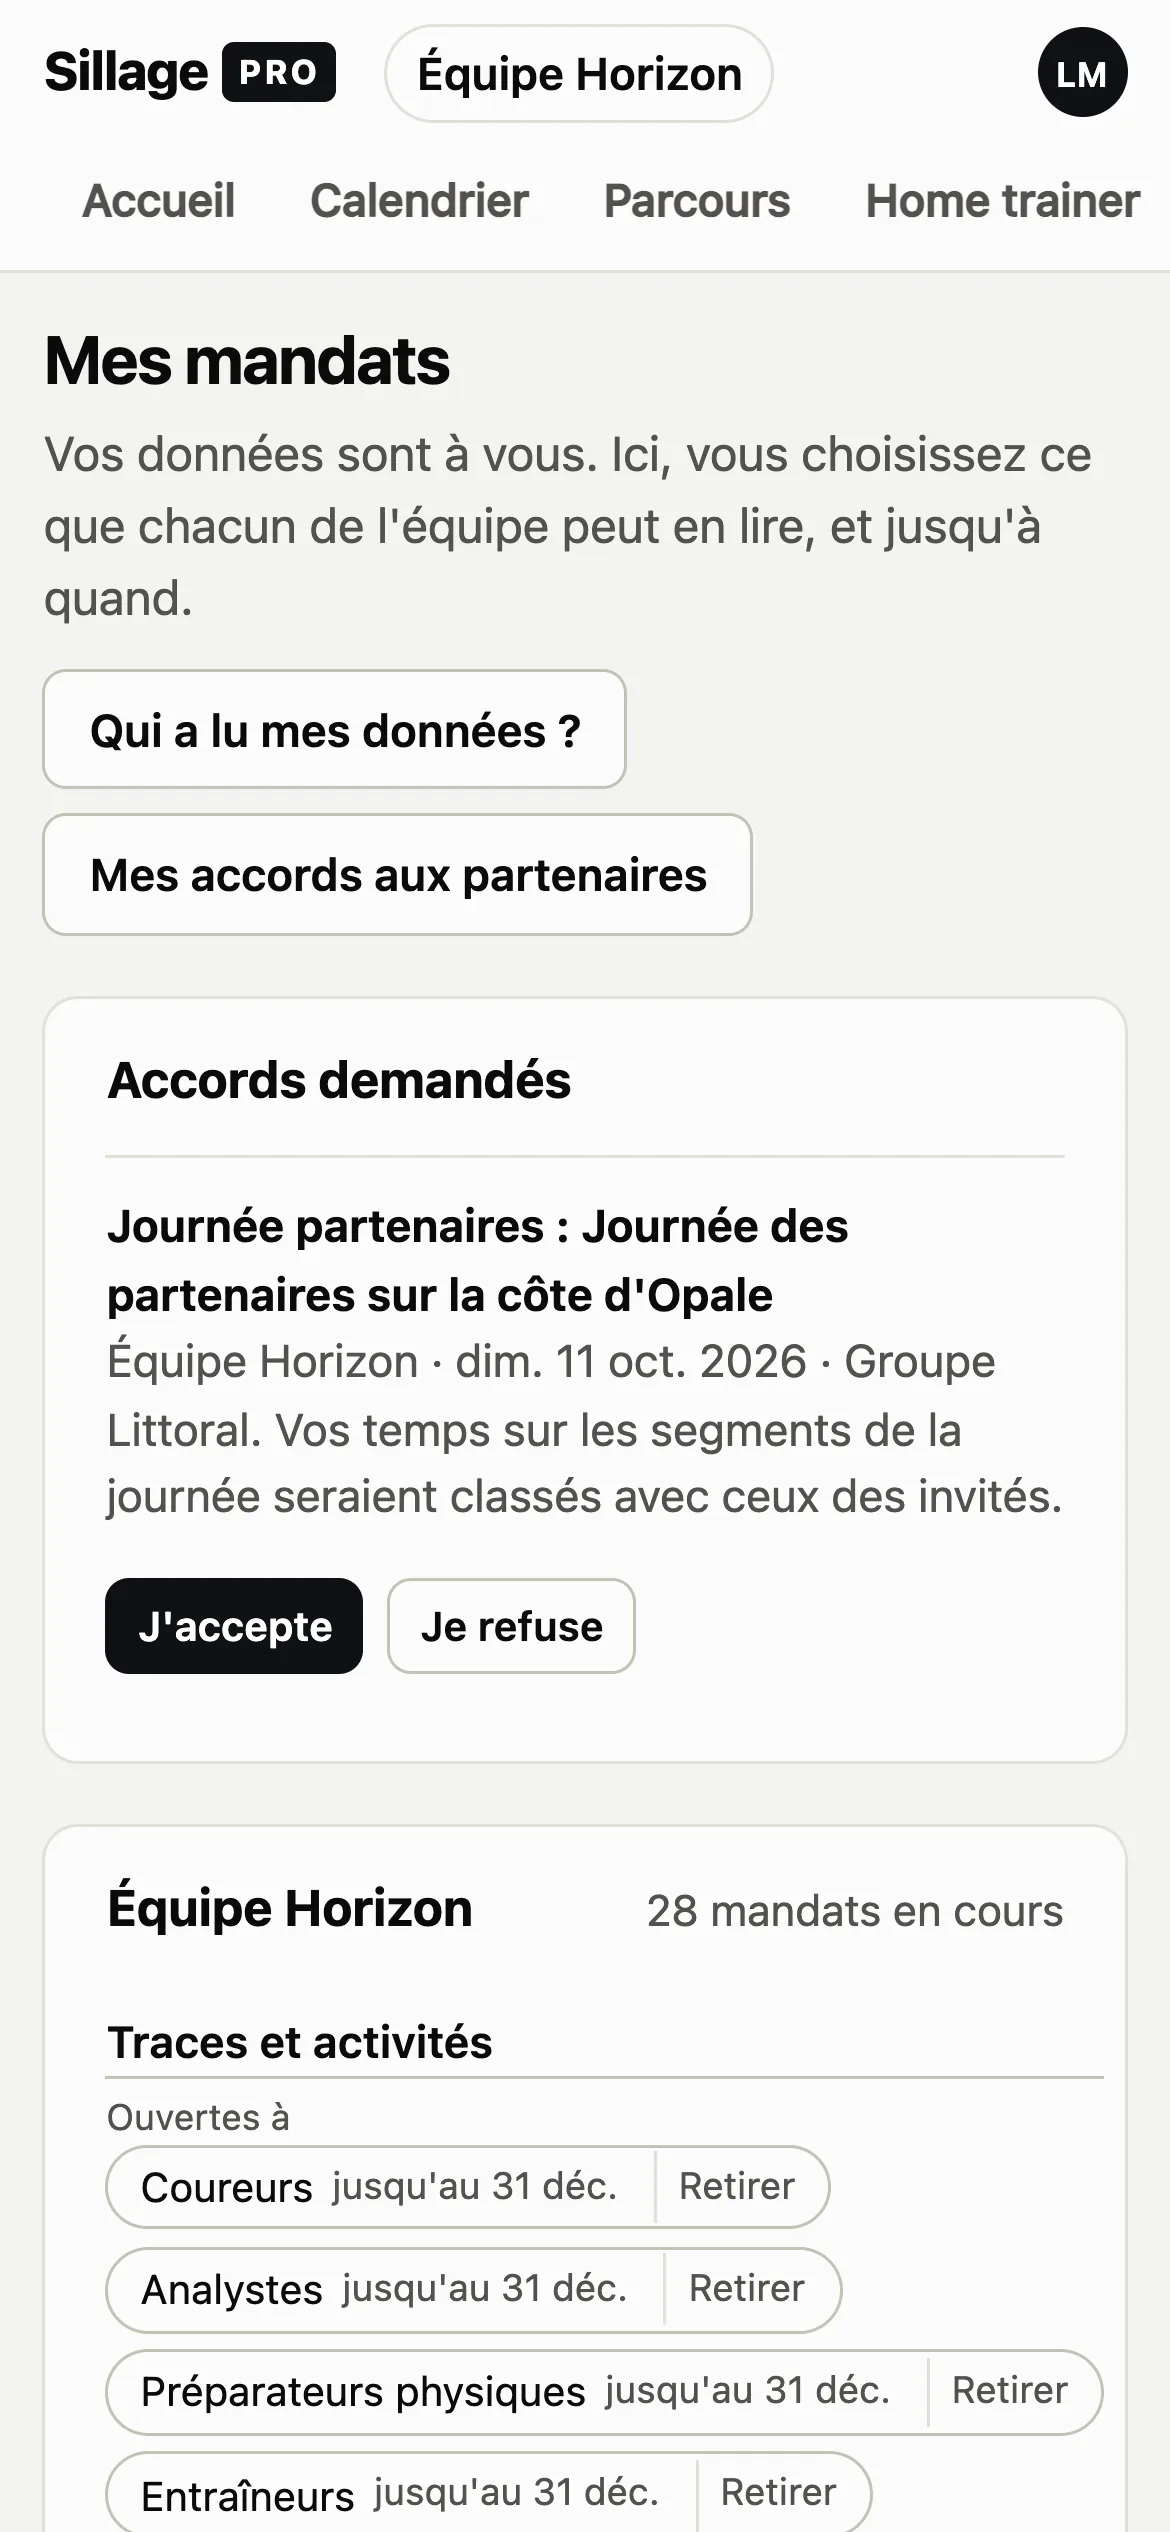
The ‘My permissions’ page on a phone: what the rider shares with the team, and a consent request for a partner day.
‘My permissions’, on the rider’s phone.
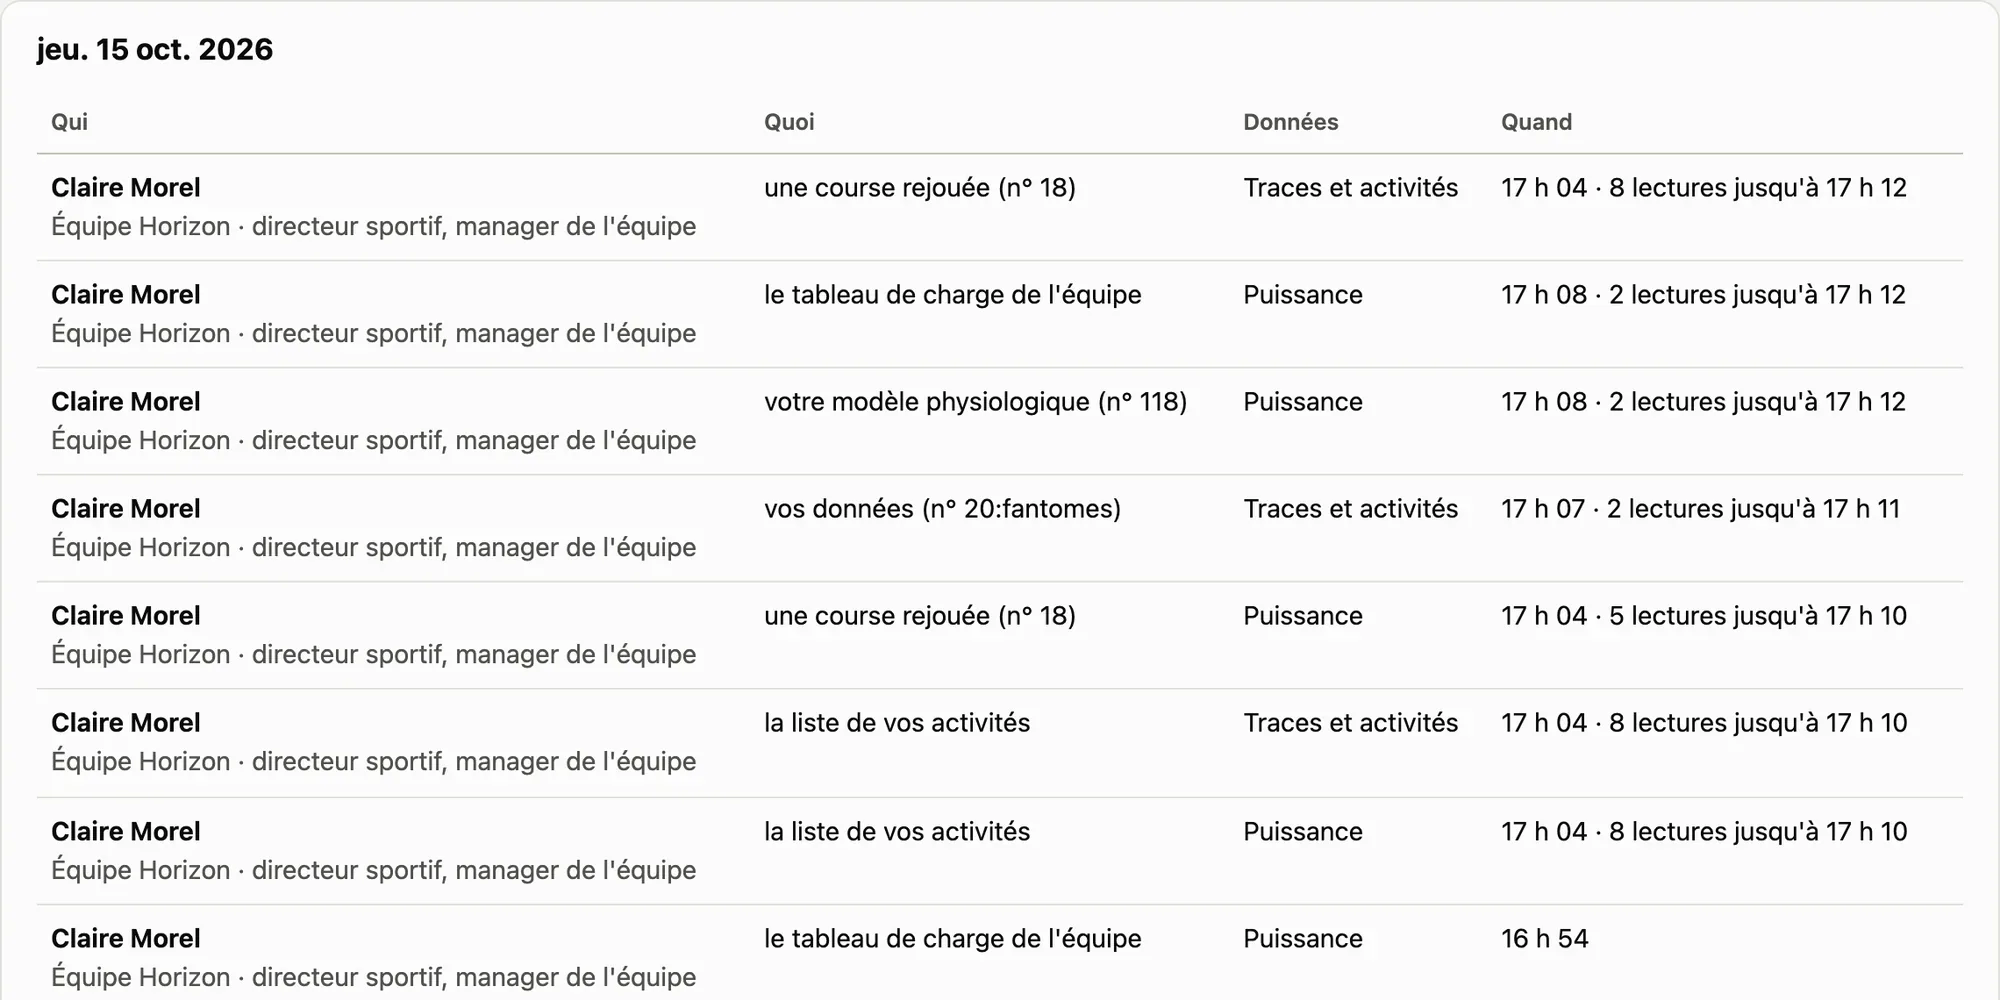
The ‘Who has viewed my data?’ log: for each view, the viewer’s name and role, what they viewed, the type of data and the time.
‘Who has viewed my data?’ The rider’s log, kept by the app.

All of Sillage Pro

Fourteen sections, one account per person, and the same rules everywhere.

What comes in

FIT, GPX, TCX, KML and CSV files · waypoints exported from VeloViewer · intervals.icu · bulk upload of bike computer files on the evening of a stage, sorted by serial number.

Demo

See it on one of your stages.

We will show you Sillage Pro with the demo team, then on the route of your next race.

Request a demo renaud@sillagepro.com